

Table of Contents IntroductionSchoolsCoursesStudentsMapsConclusionAppendix A - MethodologyAppendix - B School Tables
Table B1. 2016-17 Count and Pass Rate of K-12 Virtual Enrollments by Grade Level
Table B2. 2016-17 Pass Rate Comparison for Virtual Learners in Their Virtual and Non-Virtual Courses
Table B3. 2016-17 Number and Percentage of Schools by School Pass Rate
Table B4. 2016-17 Number of Schools and Virtual Enrollments by Entity Type
Table B6. 2016-17 Number of Full-Time Virtual or Cyber Schools with Pass Rate
Table B7. 2016-17 Number and Percentage of Schools and Virtual Enrollments by School Emphasis
Table B11. 2016-17 Percentage of Schools by Ratio of Virtual Courses to Student and School Pass Rate
Table B12. 2016-17 Number and Percentage of Schools and Virtual Enrollments by Locale
Table B15. 2016-17 Percentage of Schools with Virtual Enrollments by Building Pass Rate and Locale
Table C1. 2016-17 Number and Percentage of Virtual Enrollments with Pass Rate by Subject Area
Table C7. 2016-17 Number and Percentage of Virtual Enrollments with Pass Rate for AP Courses
Table C8. 2016-17 Virtual Enrollments Percentage by Subject Area and Locale
Table C9. 2016-17 Virtual Enrollment Pass Rates by Subject Area and Locale
Table C11. 2016-17 Number and Percentage of Virtual Enrollments with Pass Rate by Virtual Method
Table D1. 2016-17 Number of Virtual Students with Percent Year over Year Change
Table D4. 2016-17 Number and Percentage of Schools and Virtual Enrollments with Pass Rate by Gender
Table D6. 2016-17 Number and Percentage of Virtual Enrollments with Pass Rate by Poverty Status
Table D15. 2016-17 Comparison of Virtual and State Pass Rates on 11th Grade State Assessment Measures
Table D17. 2016-17 State Assessment Proficiency Rates for Virtual Learners by Poverty Status
Table D19. 2016-17 State Assessment Proficiency Rates for Virtual Learners by Virtual Type
Appendix – E Wild Cards Search CriteriaPast Effectiveness Reports Michigan’s K-12 Virtual Learning Effectiveness Report 2015-16Michigan’s K-12 Virtual Learning Effectiveness Report 2014-15Michigan’s K-12 Virtual Learning Effectiveness Report 2013-14Michigan’s K-12 Virtual Learning Effectiveness Report 2010-11 to 2012-13View Infographic Download PDF Version View Recorded Webinar
Introduction
The purpose of this report is to analyze the information on virtual learners that schools report to the state and to share the findings of that analysis with educational stakeholders in a highly consumable way that allows them to evaluate their virtual learning programs. This year’s report is the fifth edition of this annual publication. Past reports are available through the MVLRI website.The report is organized into several sections. The first section looks at schools as the unit of analysis. The next section focuses on the virtual courses taken. The third section focuses on students. There is also a brief section containing maps of virtual use. Each section is meant to capture the essential findings without being overly data intensive; however, data tables have been included in the appendices to provide those interested with more in-depth information. Information about the report’s methodology is also captured in an appendix. Please note that in some tables and figures, the percentage data may not sum to 100% due to rounding.
Schools
Fast Facts
593 school districts reported at least one virtual enrollment.
Over half of the 1,102 schools with virtual enrollments had 100 or more virtual enrollments.
73% of schools with virtual enrollments had a general education school emphasis; 25% had an alternative education emphasis.
87% of schools with virtual learning were LEA schools.
LEAs accounted for 58% of the virtual enrollments; PSA schools generated 41% of the virtual enrollments.
PSA cyber schools were responsible for 30% of the virtual enrollments.
97% of virtual enrollments came from schools with 100 or more virtual enrollments.
About 79% of virtual enrollments came from high schools.
32% of virtual enrollments came from suburban schools, the most of any locale.
Schools with a general education emphasis had a 62% virtual pass rate, outperforming those with an alternative education emphasis which had a pass rate of 44%.
27% of schools had a school-wide virtual pass rate of 90% to 100%.
Number of Districts
For the 2016-17 school year, 593 districts reported having at least one virtual enrollment. This represented two-thirds of Michigan public school districts. Within those districts, 1,102 schools reported virtual enrollments.
By Grade Level
Across the 1,102 schools, 517,470 virtual enrollments were taken. Students in 12th grade enrolled in the most virtual courses (140,639) representing approximately 27% of all virtual enrollments. The overall pass rate for virtual enrollments was 55%, a three percent decline compared to the prior year. This ranged from a high of 68% in 1st and 2nd grade to a low of 39% in 9th grade. See Table B1 for more information. In line with findings from previous years, virtual learners passed their virtual courses at a lower rate (55%) than they passed their non-virtual courses (78%). This gap of 23% is 3% larger than the 2015-16 school year. See Table B2.
By School-Level Virtual Pass Rate
Of the 1,102 schools with virtual enrollments, 296 or 27% had school-level virtual pass rates of 90% to 100%. Fifty-five percent of schools had virtual pass rates of 70% or better. See Table B3.
By Entity Type
LEA schools (58%) and PSA schools (41%) accounted for almost all the virtual enrollments. Over 950 (87%) school with virtual enrollments came from LEA schools while only 108 (10%) of the schools were PSAs. See Table B4. LEA schools and PSA schools had approximately the same virtual pass rates (55% v. 54%). See Table B5. Thirty-nine of the 52 full-time virtual buildings were LEA schools. They totaled 11,762 virtual enrollments with a 28% pass rate. In contrast, the 13 PSA cyber schools had 157,711 virtual enrollments with a pass rate of 54%. See Table B6. In total, 38% of virtual enrollments came from cyber or full-time virtual schools.
By School Emphasis
Schools designated with General Education as their emphasis produced 313,140 (61%) of the virtual enrollments. Schools with Alternative Education as their emphasis accounted for 199,317 (39%) of the virtual enrollments. See Table B7. There was a considerable difference in virtual pass rates between these two types of schools. General Education schools had a 62% virtual pass rate, whereas Alternative Education schools had a 44% virtual pass rate (see Table B8), though this, too, varied by entity type. LEA schools, for instance, had a 69% virtual pass rate for General Education schools and a 43% virtual pass rate for Alternative Education schools. See Table B9.
By Number of Virtual Enrollments
Over half of schools with virtual enrollments – 56% – had 100 or more virtual enrollments. These schools were responsible for 97% of the virtual enrollments. As has been observed in previous years, schools with less than 10 virtual enrollments were the next highest percentage of schools with 16%; however, they only generated .1% of the virtual enrollments. See Table B10.Another trend that continued was that, in general, schools with fewer virtual enrollments per students performed better. Consider for instance, that 32% of schools with an average of 1 to 2 virtual enrollments per virtual learner had a virtual pass rate of 90% to 100% whereas only 19% of schools with an average of four or more virtual courses per virtual learner had a 90% to 100% pass rate. See Table B11.
By Locale
Rural schools represented about 36% of schools with virtual enrollments. Suburban settings provided the second most schools with 29%. Suburban schools, however, tallied the largest percentage of the virtual enrollments at 32%. Rural and City locales also had more than 100,000 virtual enrollments. See Table B12. In each of the four locales, schools with 100 or more virtual enrollments accounted for the largest percentage of schools. Similarly, schools with less than 25 virtual enrollments was the second most likely scenario. See Table B13. Virtual pass rates varied by locale with rural schools having the highest virtual pass rate at 62% and those not specified having the lowest at 49%. Both city schools (13%) and those Not Specified (25%) had the highest percentage of schools with pass rates less than 20%. See Table B14 and Table B15.
Courses
Fast Facts
517,470 virtual enrollments were taken by Michigan K-12 students; the overall pass rate for virtual enrollments was 55%.
Virtual enrollments were spread across 923 different course titles.
67% of virtual enrollments occurred in the core subject areas of English Language and Literature, Mathematics, Life and Physical Sciences, and Social Sciences and History.
The course titles with the highest enrollments for each core subject were:
English Language and Literature: English 9, English 10, English 12, and English 11
Mathematics: Geometry, Algebra II, Algebra I, and Consumer Math
Life and Physical Sciences: Biology, Chemistry, Earth Science, and Physical Science
Social Sciences and History: U.S. History, Economics, World History, World History and Geography
The virtual pass rates for each core subject were:
English Language and Literature: 52%
Mathematics: 49%
Life and Physical Sciences: 53%
Social Sciences and History: 56%
29 different Advanced Placement (AP) courses were taken virtually.
The percentage of enrollments was fairly consistent by subject area across rural, town, suburban, and city schools.
Online courses (defined as including a teacher in the virtual environment) produced 80% of the virtual enrollments. Digital learning (without a teacher in the virtual environment) and blended learning (some virtual, some face-to face instruction) each accounted for about 10% of the virtual enrollments.
Number of Courses
The 517,470 virtual enrollments came from 923 different course titles (as determined by SCED Course Identified Codes).
Courses by Subject Area
English Language and Literature was the subject area with the highest virtual enrollment with 97,949 enrollments – 19% of all virtual enrollments. Social Sciences and History, Mathematics, and Life and Physical Sciences were the other subject areas with 10% or more of the virtual enrollments. In high enrollment subject areas (greater than 10,000 virtual enrollments), virtual pass rates varied from a low of 49% in Mathematics to a high of 60% for Foreign Language and Literature. See Table C1. The virtual pass rates were consistently lower than the non-virtual pass rate for the virtual learners in their non-virtual courses, a trend observed in past years. See Table C2.
Highest Virtual Enrollment Courses
For English Language and Literature, the most highly enrolled in virtual courses were 9th, 10th, 11th, and 12th grade English/Language Arts. Of those four, the pass rate was lowest for 9th grade English/Language Arts (39%) and consistently rose for each subsequent grade level to finish at 60% for 12th grade English/Language Arts. See Table C3.In Mathematics, Geometry, Algebra II, and Algebra I were the virtual courses with the highest enrollments. The pass rate across the top ten most enrolled-in virtual mathematics courses ranged from a low of 30% for Algebra 1 – Part 1 to a high of 63% for Consumer Math. See Table C4.Biology, Chemistry, and Earth Science were the three course titles responsible for more than 10% of the virtual enrollments in Life and Physical Sciences courses. A quarter of all Life and Physical Sciences virtual courses were taken in Biology. Of the top ten titles, Physical Science, Earth/Space Science, and Life Science had the lowest pass rates at 45%; the highest was Environmental Science at 62%. See Table C5.For Social Sciences and History, the three course titles of U.S. History – Comprehensive, Economics, and World History – Overview each yielded more than 10% of the virtual enrollments. Pass rates for the top ten most enrolled in courses ranged from a low of 49% in World History—Overview to a high of 73% for Psychology. See Table C6.Twenty-nine AP courses were taken virtually in 2016-17. AP Psychology was the most popular course accounting for 14% of the 3,390 AP enrollments. The pass rate for AP courses taken virtually was 86%. See Table C7. The pass rate for non-virtual AP courses taken by virtual learners was 93%.
Subject Area Enrollments by Locale
Course enrollment patterns were fairly consistent across locales. For instance, Mathematics represented between 16% and 18% of the virtual enrollments for all four (rural, town, suburb, city, and not specified) locales. The range was also 2% (13% to 15%) for Life and Physical Sciences and 4% in English Language and Literature. See Table C8. Pass rates in virtual courses also varied across subject areas and locale. For instance, in English Language and Literature, pass rates fell between 48% for not specified schools to 56% for rural schools. In Mathematics, pass rates ranged from 44% (town) to 51% (rural). See Table C9.
Subject Area Enrollments by Gender
Males and females enrolled in various subject areas in fairly similar proportions. For the four highest enrollment subject areas, the proportion of enrollment from males and females in those subject areas was within 1% of each other. Pass rates did, however, show more variability by gender. In English Language and Literature, Life and Physical Sciences, Social Sciences and History, females had a 3% higher pass rate than males. Female pass rates were 2% higher for Mathematics. See Table C10.
Courses by Virtual Method
Schools classified the virtual courses into one of three types: Blended Learning, Digital Learning, or Online Learning. According to page 463 of the Michigan Student Data System Collection Details Manual Version 1.3 for the 2016-17 school year, each type is defined as follows:
Blended Learning - A hybrid instructional delivery model where pupils are provided content, instruction, and assessment at a supervised educational facility where the pupil and teacher are in the same physical location and in part through internet-connected learning environments with some degree of pupil control over time, location, and pace of instruction. For a course to be considered blended, at least 30% of the course content is delivered online.
Digital Learning - A course of study that is capable of generating a credit or a grade that is provided in an interactive internet-connected learning environment that does not contain an instructor within the online environment itself. There may be a teacher of record assigned to the course, but this teacher does not provide instruction to students through the online environment. For a course to be considered online as opposed to blended, all (or almost all) the course content is delivered online.
Online Course - A course of study that is capable of generating a credit or a grade that is provided in an interactive internet-connected learning environment, where pupils are separated from their teachers by time or location, or both. For a course to be considered online as opposed to blended, all (or almost all) the course content is delivered online.
Blended Learning enrollments accounted for 9% of the virtual enrollments and had a pass rate of 60%. Digital Learning totaled 11% of the enrollments with a 51% pass rate. Online courses represented the majority of the enrollments (80%) and yielded a pass rate of 55%. See Table C11.
Students
Fast Facts
101,359 K-12 students took at least one virtual course which represents 7% of Michigan public school students.
88% of virtual learners were in high school; 33% were seniors and 22% were juniors.
19% of virtual learners attended a PSA cyber school or an LEA full-time virtual school; the virtual pass rate for those students was 49%.
48% of virtual learners passed all their virtual courses. One quarter of virtual learners did not pass any of their virtual courses.
Of the 25,023 students who did not pass any of their virtual courses, 46% took only one or two courses. Almost 9,500 students took and did not pass five or more virtual courses with more than 2,700 students taking and not passing 11 or more virtual courses.
Students enrolled in Michigan Virtual courses were stronger students in general as measured by a higher pass rate in their non-virtual courses (92%) compared to students who were enrolled part-time in virtual courses from a provider other than Michigan Virtual (75% pass rate). Moreover, students in Michigan Virtual courses were also more successful in their virtual courses (81% pass rate), even when considering their non- virtual performance.
Female students had a higher pass rate (57%) than did males (53%).
Students in poverty made up the majority of virtual learners (54%) and virtual enrollments (62%). Students in poverty also had a lower pass rate (48% v. 66%).
Pass rates were higher for students taking fewer virtual courses. Students taking one or two virtual courses had a 73% pass rate compared to 51% for those taking five or more.
White students represented 66% of virtual students; African-Americans were 19%.
47% of 11th grade virtual learners who took the SAT were proficient in the Reading/Writing component. About a quarter tested proficient in Science or in Math.
Student Count
For the 2016-17 school year, 101,359 Michigan K-12 students, approximately 7% of students in the state, took at least one virtual course. This was a 12% increase in the number of virtual learners compared to what was reported for 2015-16. See Table D1.
By Grade Level
Only about 3% of the state’s virtual learners were in grades K-5. Grades 6-8 were responsible for about 8% of the virtual learners. High school grade levels generated 88% of the virtual learners. Over 33% of virtual learners were high school seniors and more than 22% were juniors. See Table D1.
By Virtual Type
Approximately 19% of virtual learners attended a PSA cyber school or an LEA full-time virtual school. Students in this type represented 38% of all virtual enrollments and had a virtual pass rate of 49%. Students taking Michigan Virtual courses reflected 10% of the virtual learning population. This group totaled 4% of the virtual enrollments and had an 81% pass rate. Students from the Part-Time (Non-Michigan Virtual) type accounted for 72% of virtual learners and tallied 57% of the virtual enrollments. The pass rate for the Part-Time (Non-Michigan Virtual) type was 57%. See Table D2.There were important differences observed in the non-virtual performance of the Part-Time (Michigan Virtual) and the Part-Time (Non-Michigan Virtual) students. Part-Time (Michigan Virtual) students passed their non-virtual courses 92% of the time, whereas Part-Time (Non-Michigan Virtual) students only passed their non-virtual courses 75% of the time. See Table D3.
By Gender
There were slightly more females (51,087) enrolled in virtual courses than males (50,280), though from a percentage perspective, each represented 50% of the population. Females had a 4% higher pass rate (57% compared to 53%), continuing the trend seen in past years of females outperforming their male counterparts on this measure. See Table D4.
By Race/Ethnicity
White students made up 66% of virtual students with African American students totaling the second highest percentage with 19%. Asian students had the only pass rate (74%) above 60% See Table D5.
By Poverty Status
Fifty-four percent of virtual learners were classified as living in poverty. This is about 8% higher than the K-12 statewide average of students eligible for free or reduced lunch (46%) in the fall of 2016. Students living in poverty took 62% of the virtual enrollments for the year. This is 1% higher than the percentage of virtual enrollments from students in poverty in the 2015-16 school year. The pass rate for students in poverty (48%) was 18 percentage points lower than students who were not in poverty (66%). This gap was six percentage points higher than the previous year. See Table D6.In addition to the performance gap between those in poverty and those not in poverty, there were also differences in non-virtual pass rates. Virtual learners in poverty had a 70% pass rate in their non- virtual courses, 22 percentage points better than their virtual pass rate. Interestingly, students not in poverty had an 86% pass rate, an improvement of 20 percentage points over their virtual pass rate. Thus, unlike last year, students in poverty had a larger performance gap between their virtual and non-virtual pass rates than did students who were not in poverty. See Table D7.Differences were apparent by virtual type. Seventy-two percent of Full-Time (including Cybers) learners were in poverty compared to 54% of Part-Time (Non-Michigan Virtual) learners and 24% of the Part-Time (Michigan Virtual) learners. The pass rate for Full-Time (including Cybers) students in poverty was 46% compared to 50% for Part-Time (Non-Michigan Virtual) and 69% for Part-Time (Michigan Virtual). See Table D8.
By Seat Time Waiver Status
Students with a seat time waiver — a waiver that adjusts the requirement for the student to physically be in attendance at the school facility and lifts the cap on the number of virtual courses that can be taken away from the school — made up 18% of the virtual learners. Twenty-nine percent of virtual enrollments were taken by students on a seat time waiver. The pass rates between these two groups varied with a 48% pass rate for those on a waiver compared to 58% for those who were not on a waiver. See Table D9.
By Non-Virtual Course Performance
Virtual learners with at least three non-virtual courses were classified into one of three categories based on their success in non-virtual courses. The three categories were:
Passed all Non-Virtual Courses
Did Not Pass 1 or 2 Non-Virtual Courses
Did Not Pass 3 or More Non-Virtual Courses
In total, 65% of students had at least three or more non-virtual enrollments. Of that group, 47% of students passed all their non-virtual courses, 24% did not pass one or two, and 29% did not pass three or more. There were clear differences in virtual pass rates between the three categories. Students passing all of their non-virtual courses had an 85% virtual pass rate. Students who did not pass one or two non-virtual courses had a virtual pass rate of 60%, and those with the lowest non- virtual success had a virtual pass rate of only 38%. See Table D10.There were also differences for these three groups by virtual type. Part-Time (Michigan Virtual) learners consistently had higher virtual pass rates (90%, 76%, and 49%, respectively) compared to the Part-Time (Non-Michigan Virtual) learners (84%, 58%, and 38%, respectively). See Table D11.
By Virtual Course Performance
Forty-eight percent of virtual learners passed every virtual enrollment they took. One quarter did not pass any of their virtual enrollments, and 27% passed some, but not all of their virtual courses. Students who passed all of their virtual courses were responsible for 31% of the virtual enrollments. Students with mixed success generated 48% of the enrollments, and students who did not pass any of their virtual courses contributed 22% of the virtual enrollments. See Table D12.For the students who did not pass any of their virtual courses, 46% only took one or two virtual courses. On the other hand, 9,494 students did not pass five or more virtual courses, and a staggering 2,771 students did not pass 11 or more virtual courses. See Table D13. Further analysis of students failing all of their 11 or more virtual courses showed that 60% came from Full-Time (including Cybers). Seventy-two percent or about 1,200 of those full-time students were from PSA cyber schools. Thirty-four percent of the 2,771 students came from Part-Time (Non-Michigan Virtual), and the remaining percentage came from students who had enrollments reported by both Full-Time and Part-Time (Non-Michigan Virtual) types. The Part-Time (Michigan Virtual) type had less than 10 students (0%) failing all of their 11 or more virtual courses.From a school emphasis perspective, 51% of these students came from general education settings and 42% were enrolled through alternative education settings. None of the other settings, or combinations of the various settings, accounted for more than 3%. Finally, 77% of the 2,771 students were in poverty.
By Virtual Usage
Generally speaking, virtual learners did better when they took fewer virtual courses. Students taking one to two virtual courses had a pass rate of 73% compared to a pass rate of 58% for those taking three to four virtual courses and a pass rate of 51% for students taking five or more virtual courses. Almost half of students fell under the description of taking one or two virtual courses; however, 38% were found to have taken five or more virtual courses during the year. See Table D14.
By State Assessment
State assessment data can be used to provide an independent measure of student performance. Based on SAT and M-STEP data from students in 11th grade, virtual learners showed lower percentages reaching proficiency on the Evidence-Based Reading and Writing (SAT), Mathematics (SAT), Science (M-STEP) or Social Studies (M-STEP) examinations than the statewide proficiency rates. A little less than half of the 11th grade virtual learners tested proficient in Evidence-Based Reading and Writing and about a quarter were proficient in Mathematics or Science. See Table D15.As would be expected, the percentage of virtual learners testing proficient on these state tests varied considerably when taking into account their non-virtual performance. For instance, students taking a minimum of three non-virtual courses and passing all of them had proficiency rates that exceeded the statewide average for each of the four tests. Students who did not pass one or two of their non-virtual courses and those not passing three or more of their non-virtual courses had much lower rates of proficiency. See Table D16.Students in poverty consistently recorded proficiency rates that were 20% to 30% lower than their peers who were not in poverty. See Table D17. A similar gap, though not as big, was found with students based on their seat time waiver status. Students with a seat time waiver were 14% to 19% less likely to reach proficiency on the test than those without a waiver. See Table D18.Students taking virtual courses with Michigan Virtual had the highest rates of proficiency on the four tests, exceeding the state average on all four examinations. Part-Time (Non-Michigan Virtual) learners had rates that were higher than those from the Full-Time (including Cybers) type. See Table D19. When considering the non-virtual performance of students, the Michigan Virtual students consistently outperformed the Part-Time (Non-Michigan Virtual) type by double-digits. SeeTable D20.
Maps
Barry, Berrien, Charlevoix-Emmet, COOR, Gogebic-Ontonagon, Huron, Iosco, Jackson, Sanilac, St. Joseph, Tuscola, and West Shore ISDs had at least 10% of students in their service areas take a virtual course in 2016-17. See Figure 2.
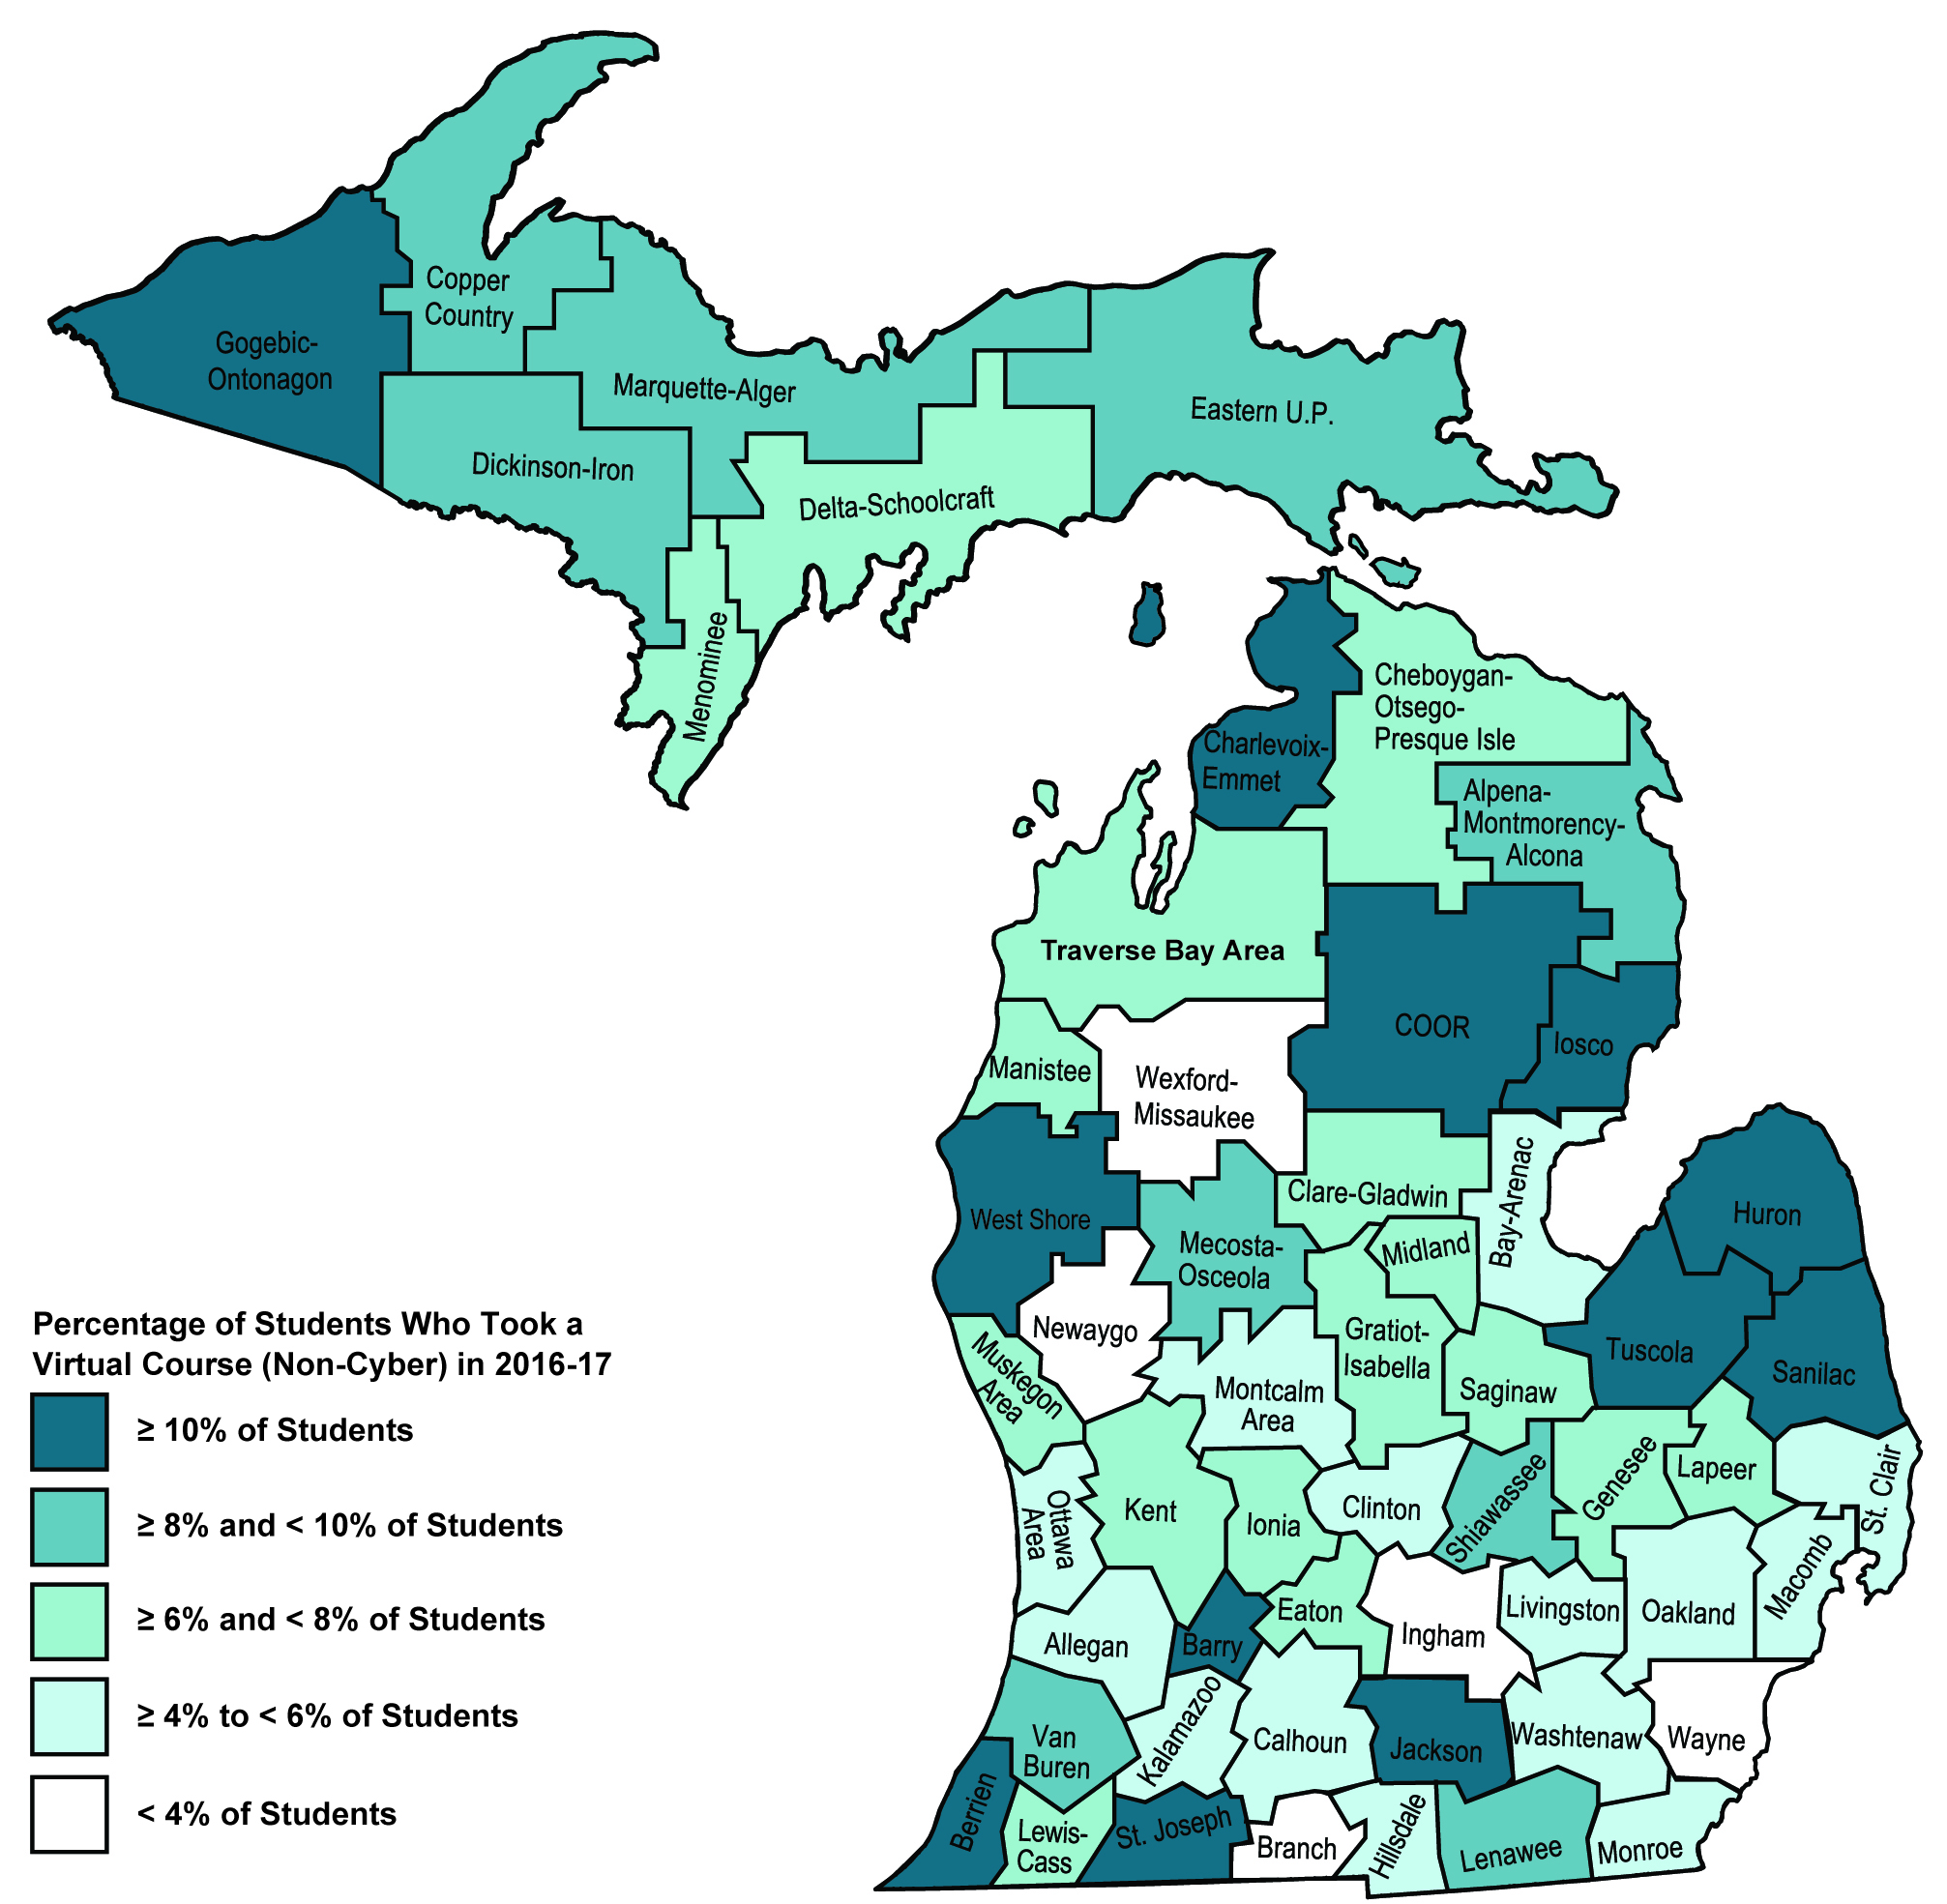
Figure 2. 2016-17 Percentage of Students Who Took a Virtual Course (Non-Cyber) by ISDOne in five students attending a PSA cyber school resided within the Wayne RESA service area. Genesee, Kent, Ingham, Macomb, and Oakland ISD each had between 500 and less than 1,000 students from their area attending PSA cyber schools. See Figure 3.
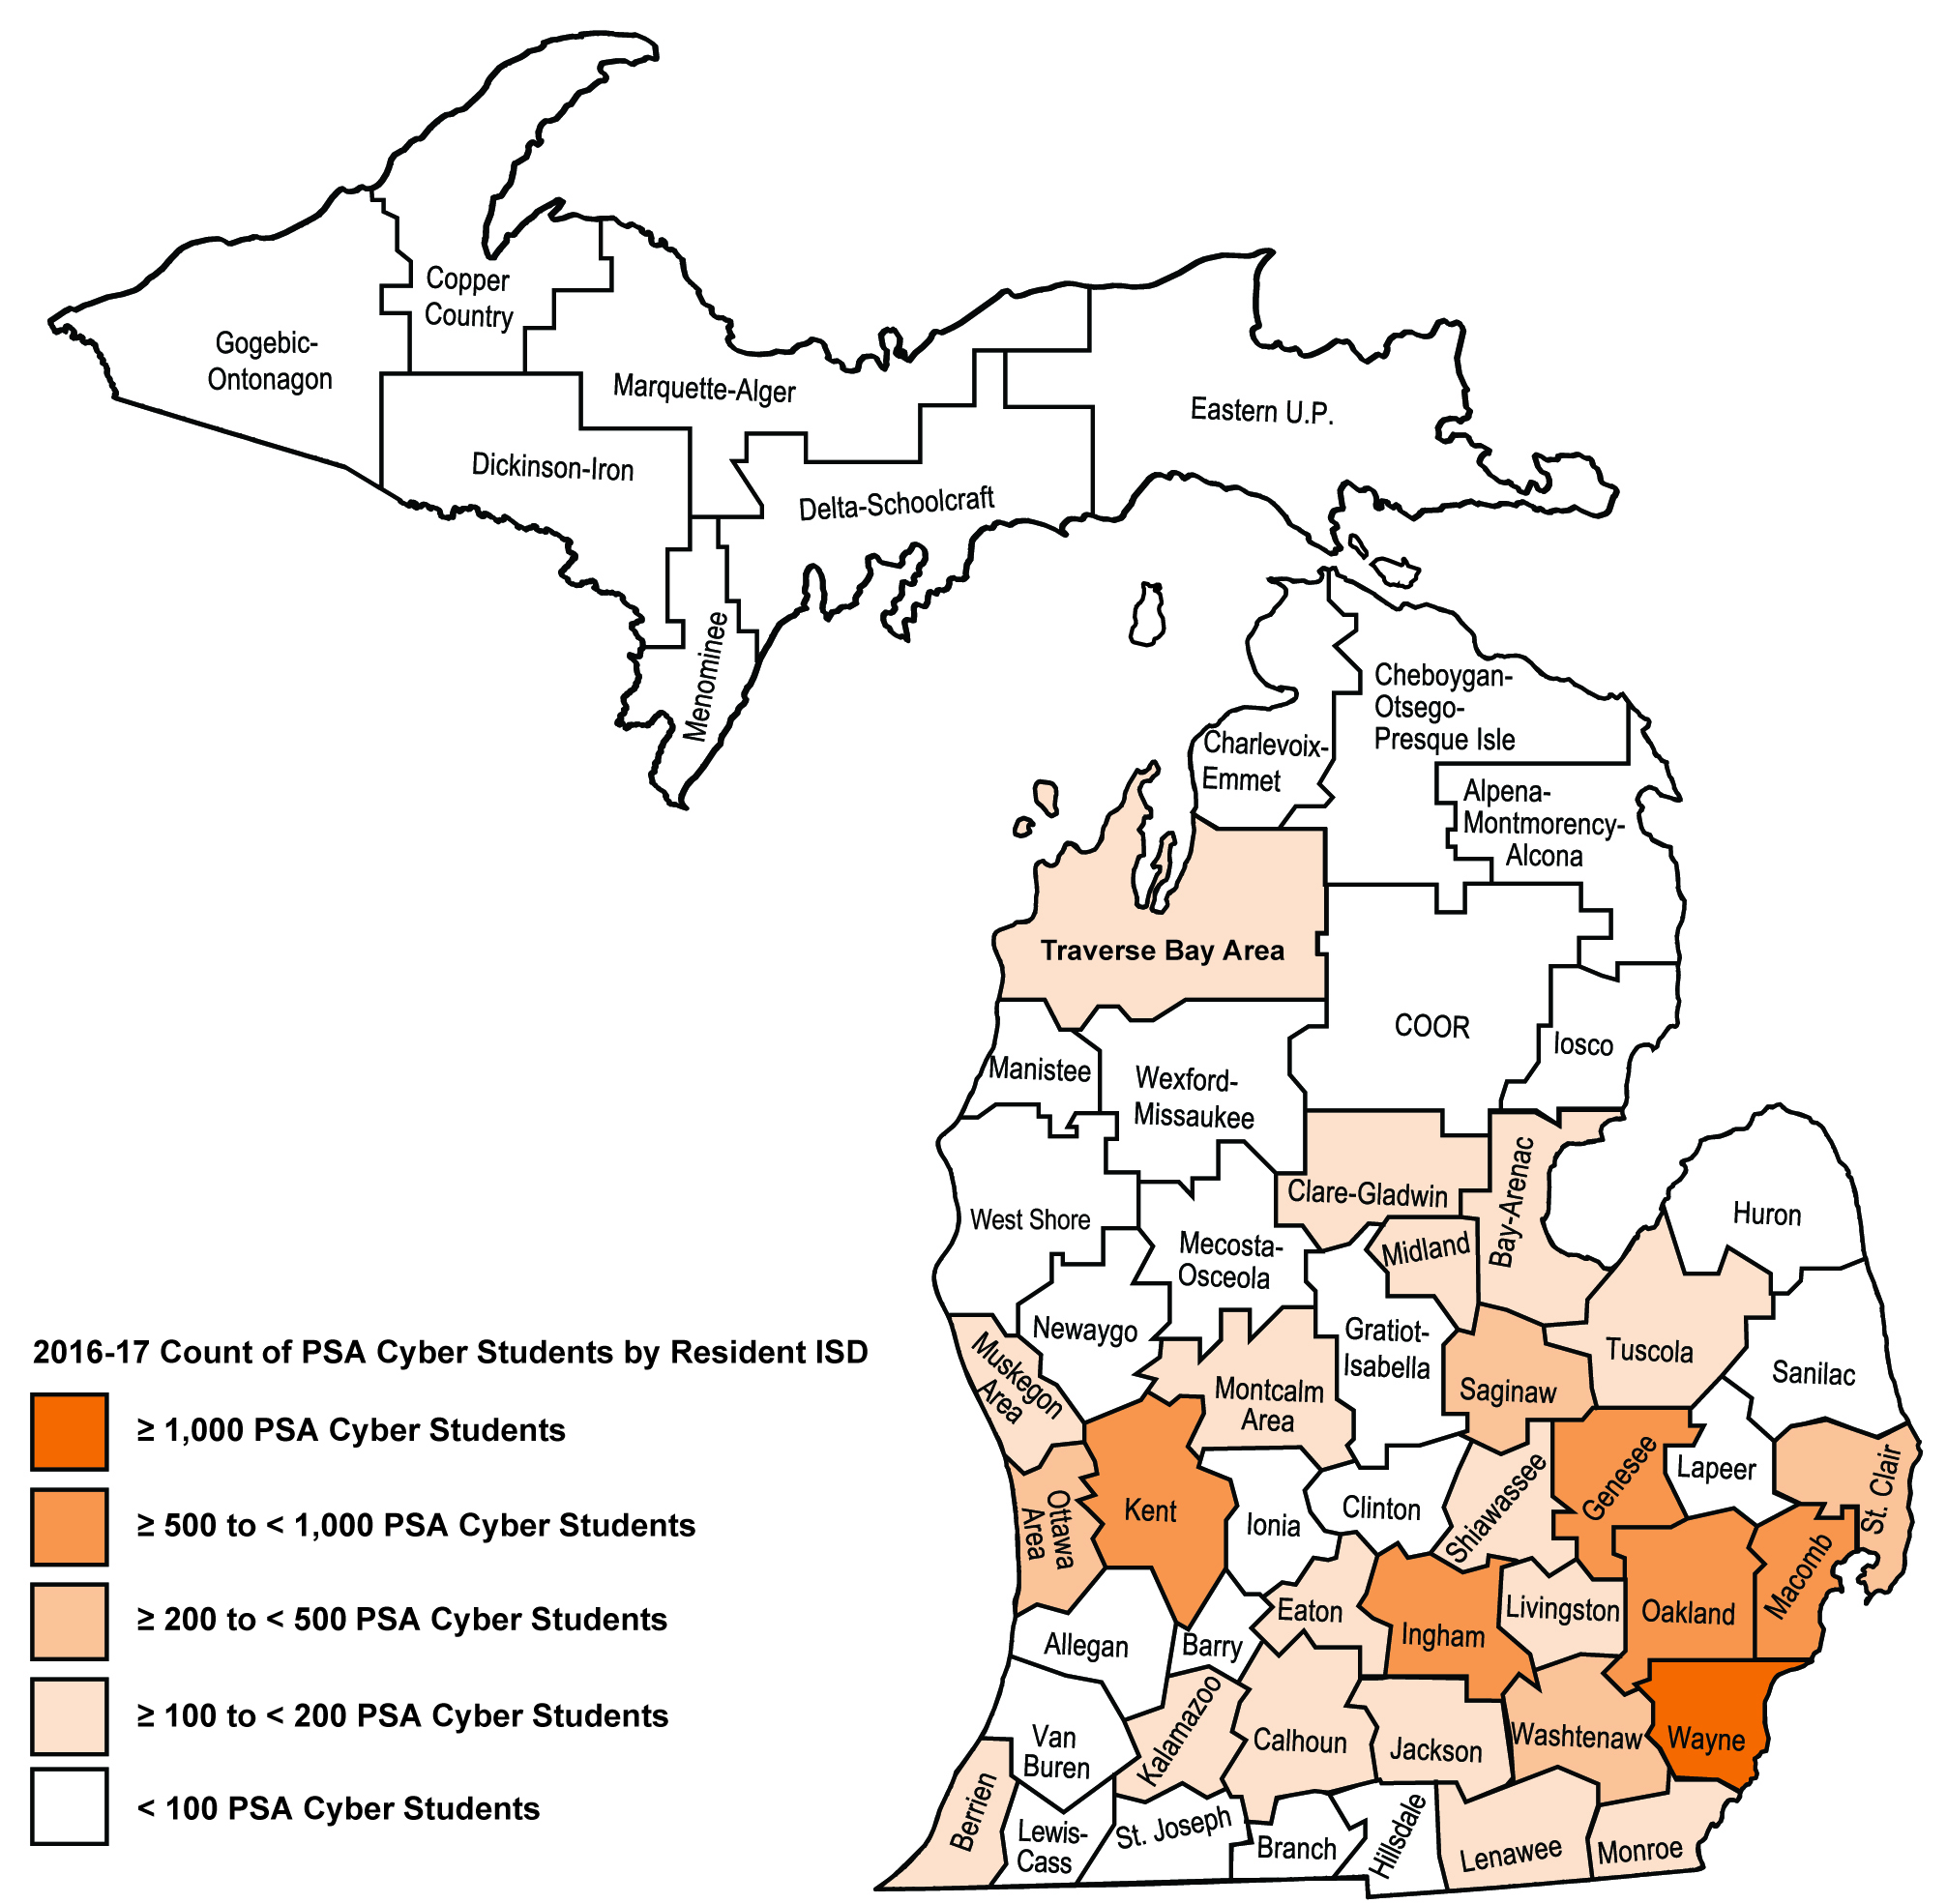
Figure 3. 2016-17 Count of PSA Cyber School Students by Resident ISDNote: Non-resident status data was available for all but one PSA cyber school. Statistics and the map found above were created based on available information.
Conclusion
This year’s report represents the seventh year of data on the effectiveness of virtual learning in Michigan’s K-12 system. Many trends witnessed in past years continue to exist. See Table 1. The use of virtual learning as evidenced by the number of virtual learners, virtual enrollments, and schools with virtual learners continues to grow. At the same time, performance in virtual courses continues to decline.Table 1.
School Year | # of Virtual Learners | # of Virtual Enrollments | # of Schools | Virtual Pass Rate |
|---|---|---|---|---|
2010-11 | 36,348 | 89,921 | 654 | 66% |
2011-12 | 52,219 | 153,583 | 850 | 62% |
2012-13 | 55,271 | 185,053 | 906 | 60% |
2013-14 | 76,122 | 319,630 | 1,007 | 57% |
2014-15 | 91,261 | 445,932 | 1,072 | 60% |
2015-16 | 90,878 | 453,570 | 1,026 | 58% |
2016-17 | 101,359 | 517,470 | 1,102 | 55% |
Summary of Virtual Learning Metrics by School Year Since 2010-11While the overall pass rate remains a reason for pessimism, the data also indicate reasons for optimism. Almost half of virtual learners passed all of their virtual courses and over a quarter of schools with virtual learners had school-wide virtual learning pass rates of 90%-100%. Unfortunately, such successful implementations of virtual learning are outnumbered by poorly performing programs. There remain many kids—too many—having little to no success with virtual learning. A quarter of students did not pass any of their virtual courses; over 2,700 of those students took 11 or more virtual courses in the year.The data in this report represent an opportunity for schools and educational stakeholders to have critical conversations about what is working and for whom it is working, and what is not working and under what circumstances those results are occurring. MVLRI has created many resources that can assist schools in reflecting upon and improving their virtual programs. These resources include an expanding series of practical guides designed for students, parents, teachers, mentors, and school board members. An administrator guide is forthcoming. MVLRI has also worked with multiple Michigan schools to provide quality reviews of their online learning programs. More information about online program review opportunities is available on the MVLRI website.
Appendix A - Methodology
About the Data
The data for this report came from the following sources:
Michigan Student Data System – School Year 2016-2017;
Educational Entity Master (EEM);
Michigan Student Data System Teacher Student Data Link (TSDL) – Collection Year 2016- 2017;
Michigan Virtual Student Enrollment List – School Year 2016-2017 (Supplied by Michigan Virtual); and
Michigan’s K-12 Virtual Learning Effectiveness Report, 2015-16 – Used for comparing this year’s data with the 2015-16 school year. That report is available as a free download from /research/publications/michigans-k-12-virtual-learning-effectiveness-report-2015-16/
Because the data for this report incorporates this variety of sources, the findings within may differ from those found through the MI School Data portal which may use different query parameters.Virtual Learners were categorized into three types:
Part-Time (Michigan Virtual) – virtual enrollments from students who were identified as taking at least one online course with Michigan Virtual. Michigan Virtual runs a state- supported supplementary virtual school program that was created by Public Act 230 of 2000;
Part-Time (Non-Michigan Virtual) – Like the prior type, this type is also for a la carte virtual enrollments taken by students. However, the courses were taken from a provider other than Michigan Virtual; and
Full-Time (including Cybers) – enrollments from cyber schools or full-time virtual LEA schools. Cyber schools provide full-time instruction through online learning. Cyber schools were first created through Public Act 205 of 2009. Public Act 129 of 2012 expanded the number of cyber school contracts that could be issued in the state.
The majority of enrollments classified as virtual in this report were treated as such due to the TSDL virtual method field indicating virtual delivery. However, this field is known to contain inaccuracies. For the purposes of this report, additional methods were used to identify enrollments with a high likelihood of having been delivered virtually. Each of the methods used, along with the percentage of enrollments it contributed to the total, are outlined below.
TSDL Virtual Method Flag = Yes. Enrollments where the TSDL virtual method field was set to “Blended Learning,” “Digital Learning,” or “Online Course” were treated as virtual. According to the TSDL Data Collection Manual, the virtual method field “indicates the type of virtual instruction the student is receiving. This could be virtual learning, online learning or computer courses; distance learning; or self-scheduled virtual learning” (see page 463 of the TSDL manual available from http://www.michigan.gov/documents/cepi/Collection_Details_SY1617_v1.0_524119_7.pdf# comp-stucourse). This strategy yielded 98% (509,467) of the virtual enrollments.
TSDL Local Course Title Field References Michigan Virtual. The strategy of searching the local course title field for common references to Michigan Virtual yielded less than 1% (733) of the virtual enrollments. See Appendix E for a list of search criteria.
Cyber School Enrollments Not Marked as Virtually Delivered. Less than 1% (1,158) were enrollments reported by cyber schools that were not marked as being delivered virtually.
Local Course Title Field References Common Third Party Providers. Searching the local course title field for common references to known third-party providers of virtual courses yielded less than 1% (2,978) of the virtual enrollments. See Appendix E for a list of search criteria.
TSDL Local Course Title Field References Common Generic Labels for Online or Virtual Learning. Searching the local course title field for common references to online, distance, or virtual learning yielded less than 1% (3,134) of the virtual enrollments. See Appendix E for a list of search criteria.
To determine virtual type, the following process was used:
If a student was flagged as having at least one virtual enrollment with Michigan Virtual, all virtually delivered enrollments for that student were flagged as being provided by Michigan Virtual. It is worth noting that not all of the virtual enrollments from these students were delivered by Michigan Virtual, but there was no clear way to determine which of the virtual enrollments were not from Michigan Virtual. Therefore, this report attributes all virtual enrollments from these students to Michigan Virtual.
All enrollments reported by schools labeled as “cyber schools” or full-time virtual that were not from students who had taken a virtual course with Michigan Virtual were labeled under the Full-Time (including Cybers) type.
All other enrollments that were delivered virtually were labeled under the Part-Time (Non- Michigan Virtual) type. A small number of students had virtual enrollments recorded under both the Full-Time (including Cybers) and Part-Time (Non-Michigan Virtual) types.
Pass Rate Calculations
There exist various ways to calculate a pass rate; but as used in this report, it is simply the percentage of enrollments with a completion status of “Completed/Passed.” This formula remains consistent with past reports.
Data Limitations
Because of the methodology described above, some enrollments are counted as virtual in this report that should not be – either because they were mistakenly marked as virtual by the school and/or because the local course title searches implemented by the research team yielded false positives. On the other hand, it is also safe to assume that some enrollments that should have been marked as virtual were not, both because they were not correctly flagged by the school and because the local course title did not give an indication of its virtual nature that aligned with the conventions used in the strategies outlined above. Consequently, the figures in this report should be treated as estimates that, generally speaking, convey the trends observed for the school year.One final caveat for interpreting the results published in this report: There is clear variability in what schools report to the state as a “course.” Some records align well with reporting conventions outlined by the U.S. Department of Education under their School Codes for the Exchange of Data (SCED). However, a review of the data suggests that many schools submit course records that may be better described as course units or lessons. Hence, while one district may report a single course for a child, for instance, Algebra I, another school might submit five such records, all with the same subject areas and course identifier codes, but with different local course IDs. Table 2 provides a glimpse into such reporting variability. Consider the Part-Time (Non-Michigan Virtual) type. For that group, 43% of the students had 11 to 15 courses (includes both virtual and non-virtual enrollments), but many students had more than that. Overall, however, such “over-reporting” seems to have more of an impact on enrollment counts than on the “Completed/Passed” rates reported.Table 2.
Course Count by Student (Virtual and Non-Virtual) | Part-Time (Michigan Virtual) | Part-Time (Non-MV) | Full-Time (including Cyber) |
|---|---|---|---|
1 to 5 | 4% | 13% | 10% |
6 to 10 | 22% | 25% | 33% |
11 to 15 | 61% | 43% | 51% |
16 to 20 | 12% | 13% | 5% |
21+ | 1% | 6% | 1% |
Total | 100% | 100% | 100% |
Student Virtual and Non-Virtual Course Counts by Virtual Type
Appendix - B School Tables
Note: Clicking on the orange hyperlinked table number will return to the section of the report that discusses the table.Table B1.
Grade Level | # of Enrolls | % Change | Pass Rate | % Change from 15-16 |
|---|---|---|---|---|
K | 6,188 | -2% | 65% | -5% |
1 | 7,522 | -11% | 68% | 1% |
2 | 8,799 | -11% | 68% | 10% |
3 | 8,903 | -7% | 66% | 9% |
4 | 9,686 | -11% | 66% | -2% |
5 | 10,598 | -2% | 66% | 1% |
6 | 13,638 | -7% | 59% | -5% |
7 | 19,277 | -1% | 58% | -7% |
8 | 23,978 | 1% | 58% | -5% |
9 | 80,075 | 19% | 39% | -6% |
10 | 90,844 | 20% | 48% | -3% |
11 | 97,323 | 22% | 54% | -4% |
12 | 140,639 | 20% | 63% | 0% |
Total | 517,470 | 14% | 55% | -3% |
2016-17 Count and Pass Rate of K-12 Virtual Enrollments by Grade LevelTable B2.
Grade Level | Virtual Pass Rate | Non-Virtual Pass Rate |
|---|---|---|
K | 65% | 60% |
1 | 68% | 49% |
2 | 68% | 67% |
3 | 66% | 79% |
4 | 66% | 64% |
5 | 66% | 75% |
6 | 59% | 76% |
7 | 58% | 79% |
8 | 58% | 74% |
9 | 39% | 70% |
10 | 48% | 74% |
11 | 54% | 80% |
12 | 63% | 82% |
Total | 55% | 78% |
2016-17 Pass Rate Comparison for Virtual Learners in Their Virtual and Non-Virtual CoursesTable B3.
School Pass Rate | # of Schools | % of Schools |
|---|---|---|
0% to <10% | 61 | 6% |
10% to <20% | 40 | 4% |
20% to <30% | 45 | 4% |
30% to <40% | 53 | 5% |
40% to <50% | 85 | 8% |
50% to <60% | 99 | 9% |
60% to <70% | 115 | 10% |
70% to <80% | 158 | 14% |
80% to <90% | 150 | 14% |
90% to 100% | 296 | 27% |
Total | 1,102 | 100% |
2016-17 Number and Percentage of Schools by School Pass RateTable B4.
Entity Type | # of Schools | # of Virtual Enrolls | % of Virtual Enrolls |
|---|---|---|---|
ISD School | 28 | 6,790 | 1% |
LEA School | 956 | 296,058 | 57% |
LEA Unique Education Provider | <10 | <4,235 | 1% |
PSA School | 108 | 210,387 | 41% |
State School | <10 | <10 | 0% |
Total | 1,102 | 517,470 | 100% |
2016-17 Number of Schools and Virtual Enrollments by Entity TypeNote: < values are used as cell suppression techniques.Table B5.
Entity Type | Pass Count | # of Virtual Enrolls | Pass Rate |
|---|---|---|---|
ISD School | 3,468 | 6,790 | 51% |
LEA School | 163,167 | 296,058 | 55% |
LEA Unique Education Provider | <3,052 | <4,235 | 72% |
PSA School | 114,331 | 210,387 | 54% |
State School | <10 | <10 | NR |
Total | 284,017 | 517,470 | 55% |
2016-17 Virtual Pass Rate by Entity TypeNote: < values are used as cell suppression techniques. The pass rate for State Schools is not reported due to the low number of enrollments.Table B6.
Entity Type | # of Schools | Pass Count | # of Virtual Enrolls | Pass Rate |
|---|---|---|---|---|
LEA School | 39 | 11,762 | 41,500 | 28% |
PSA School | 13 | 84,848 | 157,711 | 54% |
Total | 52 | 96,610 | 199,211 | 48% |
2016-17 Number of Full-Time Virtual or Cyber Schools with Pass RateTable B7.
School Emphasis | # of Schools | % of Schools | # of Virtual Enrolls | % of Virtual Enrolls |
|---|---|---|---|---|
Alternative Education | 270 | 25% | 199,317 | 39% |
General Education | 803 | 73% | 313,140 | 61% |
Reportable Program | <10 | 0% | 594 | 0% |
Special Education | 25 | 2% | 4,208 | 1% |
Vocational/CTE | <10 | 0% | 211 | 0% |
Total | 1,102 | 100% | 517,470 | 100% |
2016-17 Number and Percentage of Schools and Virtual Enrollments by School EmphasisTable B8.
School Emphasis | Pass Count | # of Virtual Enrolls | Pass Rate |
|---|---|---|---|
Alternative Education | 87,983 | 199,317 | 44% |
General Education | 193,452 | 313,140 | 62% |
Reportable Program | 524 | 594 | 88% |
Special Education | 1,865 | 4,208 | 44% |
Vocational/CTE | 193 | 211 | 91% |
Total | 284,017 | 517,470 | 55% |
2016-17 Virtual Pass Rate by School EmphasisTable B9.
Entity Type | General Ed Pass Rate | Alternative Ed Pass Rate |
|---|---|---|
ISD School | 79% | 40% |
LEA School | 69% | 43% |
LEA Unique Education Provider | NA | 72% |
PSA School | 56% | 48% |
State School | NA | NA |
Total | 62% | 44% |
2016-17 Virtual Pass Rates for General Education and Alternative Education Schools by Entity TypeNote: NA is used for cells with less than 15 enrollments.Table B10.
# of Virtual Enrolls Per School | # of Schools | % of Schools | # of Virtual Enrolls | % of Virtual Enrolls |
|---|---|---|---|---|
1 to 9 | 174 | 16% | 710 | 0% |
10 to 19 | 74 | 7% | 1,041 | 0% |
20 to 29 | 44 | 4% | 1,042 | 0% |
30 to 39 | 35 | 3% | 1,207 | 0% |
40 to 49 | 33 | 3% | 1,455 | 0% |
50 to 59 | 30 | 3% | 1,622 | 0% |
60 to 69 | 32 | 3% | 2,083 | 0% |
70 to 79 | 21 | 2% | 1,558 | 0% |
80 to 89 | 24 | 2% | 2,040 | 0% |
9o to 99 | 22 | 2% | 2,072 | 0% |
100+ | 613 | 56% | 502,640 | 97% |
Total | 1,102 | 100% | 517,470 | 100% |
2016-17 Number and Percentage of Schools and Virtual Enrollments by Number of Virtual Enrollments per SchoolTable B11.
School Pass Rate | 1 to 2 Virtual Courses / Learner | 3 to 4 Virtual Courses / Learner | 4+ Virtual Courses / Learner |
|---|---|---|---|
0% to <10% | 7% | 5% | 5% |
10% to <20% | 1% | 3% | 8% |
20% to <30% | 2% | 3% | 9% |
30% to <40% | 3% | 2% | 11% |
40% to <50% | 4% | 6% | 15% |
50% to <60% | 9% | 9% | 10% |
60% to <70% | 11% | 12% | 7% |
70% to <80% | 13% | 17% | 12% |
80% to <90% | 18% | 16% | 4% |
90% to 100% | 32% | 27% | 19% |
Total | 100% | 100% | 100% |
2016-17 Percentage of Schools by Ratio of Virtual Courses to Student and School Pass RateTable B12.
Locale | # of Schools | % of Schools | # of Virtual Enrolls | % of Virtual Enrolls |
|---|---|---|---|---|
City | 173 | 16% | 111,791 | 22% |
Not Specified | 44 | 4% | 39,575 | 8% |
Rural | 393 | 36% | 100,366 | 19% |
Sub | 321 | 29% | 166,054 | 32% |
Town | 171 | 16% | 99,684 | 19% |
Total | 1,102 | 100% | 517,470 | 100% |
2016-17 Number and Percentage of Schools and Virtual Enrollments by LocaleTable B13.
Locale | 1 to 24 Virtual Enrolls | 25 to 49 Virtual Enrolls | 50 to 74 Virtual Enrolls | 75 to 99 Virtual Enrolls | 100+ Virtual Enrolls | Total |
|---|---|---|---|---|---|---|
City | 29% | 9% | 5% | 3% | 54% | 100% |
Not Specified | 20% | 7% | 5% | 5% | 64% | 100% |
Rural | 24% | 9% | 9% | 7% | 51% | 100% |
Sub | 27% | 7% | 4% | 6% | 57% | 100% |
Town | 20% | 4% | 10% | 2% | 64% | 100% |
2016-17 Percentage of Schools with Virtual Enrollments by Virtual Enrollment Totals and LocaleTable B14.
Locale | Pass Rate | % Change from 15-16 |
|---|---|---|
City | 51% | +1% |
Not Specified | 49% | -5% |
Rural | 62% | -2% |
Sub | 57% | -4% |
Town | 53% | -17% |
Total | 55% | -3% |
2016-17 Virtual Pass Rate by LocaleTable B15.
Locale | 0% to <20% Pass Rate | 20% to <40% Pass Rate | 40% to <60% Pass Rate | 60% to <80% Pass Rate | 80% to 100% Pass Rate | Total |
|---|---|---|---|---|---|---|
City | 13% | 9% | 12% | 21% | 45% | 100% |
Not Specified | 25% | 25% | 14% | 7% | 30% | 100% |
Rural | 6% | 7% | 18% | 30% | 40% | 100% |
Sub | 9% | 10% | 15% | 23% | 43% | 100% |
Town | 9% | 6% | 24% | 25% | 36% | 100% |
2016-17 Percentage of Schools with Virtual Enrollments by Building Pass Rate and Locale
Appendix - C Course Tables
Note: Clicking on the orange hyperlinked table number will return to the section of the report that discusses the table.Table C1.
Subject Area | # of Enrolls | % of Enrolls | Pass Rate |
|---|---|---|---|
Agriculture, Food, and Natural Resources | 581 | 0% | 77% |
Architecture and Construction | 244 | 0% | 85% |
Business and Marketing | 8,091 | 2% | 64% |
Communication and Audio / Visual Technology | 2,063 | 0% | 74% |
Computer and Information Sciences | 10,900 | 2% | 57% |
Engineering and Technology | 5,143 | 1% | 59% |
English Language and Literature | 97,949 | 19% | 52% |
Fine and Performing Arts | 25,776 | 5% | 57% |
Foreign Language and Literature | 29,618 | 6% | 60% |
Health Care Sciences | 3,431 | 1% | 81% |
Hospitality and Tourism | 684 | 0% | 73% |
Human Services | 1,281 | 0% | 77% |
Life and Physical Sciences | 73,669 | 14% | 53% |
Manufacturing | 58 | 0% | 91% |
Mathematics | 89,101 | 17% | 49% |
Military Science | 37 | 0% | 78% |
Miscellaneous | 40,322 | 8% | 53% |
Nonsubject Specific | 4,695 | 1% | 98% |
Physical, Health, and Safety Education | 35,590 | 7% | 59% |
Public, Protective, and Government Services | 1,535 | 0% | 78% |
Religious Education and Theology | 109 | 0% | 81% |
Social Sciences and History | 86,477 | 17% | 56% |
Transportation, Distribution, and Logistics | 116 | 0% | 95% |
Total | 517,470 | 100% | 55% |
2016-17 Number and Percentage of Virtual Enrollments with Pass Rate by Subject AreaTable C2.
Subject Area | Virtual Pass Rate | Non-Virtual Pass Rate |
|---|---|---|
Agriculture, Food, and Natural Resources | 77% | 88% |
Architecture and Construction | 85% | 88% |
Business and Marketing | 64% | 84% |
Communication and Audio / Visual Technology | 74% | 87% |
Computer and Information Sciences | 57% | 80% |
Engineering and Technology | 59% | 88% |
English Language and Literature | 52% | 78% |
Fine and Performing Arts | 57% | 86% |
Foreign Language and Literature | 60% | 76% |
Health Care Sciences | 81% | 83% |
Hospitality and Tourism | 73% | 74% |
Human Services | 77% | 83% |
Life and Physical Sciences | 53% | 77% |
Manufacturing | 91% | 87% |
Mathematics | 49% | 74% |
Military Science | 78% | 64% |
Miscellaneous | 53% | 75% |
Nonsubject Specific | 98% | 82% |
Physical, Health, and Safety Education | 59% | 81% |
Public, Protective, and Government Services | 78% | 84% |
Religious Education and Theology | 81% | 91% |
Social Sciences and History | 56% | 77% |
Transportation, Distribution, and Logistics | 95% | 84% |
Total | 55% | 78% |
2016-17 Pass Rate Comparison for Virtual Learners for Their Virtual and Non-Virtual Courses by Subject AreaTable C3.
English Language and Literature Course Titles | # of Enrolls | % of Enrolls | Pass Rate |
|---|---|---|---|
English / Language Arts I (9th grade) | 18,192 | 19% | 39% |
English / Language Arts II (10th grade) | 16,154 | 16% | 43% |
English / Language Arts IV (12th grade) | 13,637 | 14% | 60% |
English / Language Arts III (11th grade) | 13,522 | 14% | 53% |
Language Arts (grade 5) | 3,152 | 3% | 61% |
Language Arts (grade 4) | 2,583 | 3% | 58% |
Language Arts (grade 7) | 2,489 | 3% | 51% |
Language Arts (grade 8) | 2,424 | 2% | 54% |
English Language and Literature - Other | 2,334 | 2% | 53% |
Language Arts (grade 3) | 2,040 | 2% | 58% |
Total | 76,527 | 78% | 50% |
2016-17 Number and Percentage of Virtual Enrollments with Pass Rate by Course Title for the Top 10 Most Enrolled in English Language and Literature CoursesNote: % of Enrolls based on the overall total of 97,949 for this subject area.Table C4.
Mathematics Course Titles | # of Enrolls | % of Enrolls | Pass Rate |
|---|---|---|---|
Geometry | 16,845 | 19% | 44% |
Algebra II | 14,580 | 16% | 53% |
Algebra I | 12,610 | 14% | 38% |
Consumer Math | 6,115 | 7% | 63% |
Algebra I-Part 1 | 4,453 | 5% | 30% |
Algebra I-Part 2 | 4,279 | 5% | 35% |
Pre-Algebra | 4,168 | 5% | 42% |
Mathematics - Other | 2,866 | 3% | 52% |
Mathematics (grade 7) | 2,639 | 3% | 52% |
General Math | 2,618 | 3% | 50% |
Total | 71,173 | 80% | 46% |
2016-17 Number and Percentage of Virtual Enrollments with Pass Rate by Course Title for the Top 10 Most Enrolled in Mathematics CoursesNote: % of Enrolls based on the overall total of 89,101 for this subject area.Table C5.
Life and Physical Sciences Course Titles | # of Enrolls | % of Enrolls | Pass Rate |
|---|---|---|---|
Biology | 18,412 | 25% | 47% |
Chemistry | 13,607 | 18% | 52% |
Earth Science | 9,821 | 13% | 48% |
Physical Science | 5,544 | 8% | 45% |
Physics | 3,052 | 4% | 61% |
Environmental Science | 2,938 | 4% | 62% |
Life and Physical Sciences - Other | 2,033 | 3% | 56% |
Earth / Space Science | 1,466 | 2% | 45% |
Integrated Science | 1,371 | 2% | 58% |
Life Science | 1,167 | 2% | 45% |
Total | 59,411 | 81% | 50% |
2016-17 Number and Percentage of Virtual Enrollments with Pass Rate by Course Title for the Top 10 Most Enrolled in Life and Physical Sciences CoursesNote: % of Enrolls based on the overall total of 73,669 for this subject area.Table C6.
Social Sciences and History Course Titles | # of Enrolls | % of Enrolls | Pass Rate |
|---|---|---|---|
U.S. History - Comprehensive | 13,572 | 16% | 50% |
Economics | 10,237 | 12% | 56% |
World History - Overview | 9,382 | 11% | 49% |
World History and Geography | 6,440 | 7% | 58% |
U.S. Government - Comprehensive | 5,826 | 7% | 56% |
Psychology | 3,681 | 4% | 73% |
Civics | 3,637 | 4% | 50% |
Modern U.S. History | 2,631 | 3% | 52% |
Sociology | 2,377 | 3% | 72% |
Social Studies (grade 7) | 2,156 | 2% | 50% |
Total | 59,939 | 69% | 55% |
2016-17 Number and Percentage of Virtual Enrollments with Pass Rate by Course Title for the Top 10 Most Enrolled in Social Sciences and History CoursesNote: % of Enrolls based on the overall total of 86,477 for this subject area.Table C7.
AP Course Title | # of Enrolls | % of Enrolls | Pass Rate |
|---|---|---|---|
AP Art-History of Art | 66 | 2% | 77% |
AP Biology | 297 | 9% | 83% |
AP Calculus AB | 189 | 6% | 90% |
AP Calculus BC | 99 | 3% | 79% |
AP Chemistry | 182 | 5% | 95% |
AP Comparative Government and Politics | 10 | 0% | 100% |
AP Computer Science A | 223 | 7% | 91% |
AP Computer Science AB | 33 | 1% | 64% |
AP Economics | 23 | 1% | 91% |
AP English Language and Composition | 259 | 8% | 76% |
AP English Literature and Composition | 174 | 5% | 84% |
AP Environmental Science | 46 | 1% | 83% |
AP European History | <10 | 0% | 100% |
AP French Language and Culture | 16 | 0% | 88% |
AP German Language and Culture | <10 | 0% | 100% |
AP Government | 201 | 6% | 97% |
AP Human Geography | 19 | 1% | 89% |
AP Macroeconomics | 165 | 5% | 82% |
AP Microeconomics | 111 | 3% | 86% |
AP Music Theory | <10 | 0% | 100% |
AP Physics B | 115 | 3% | 89% |
AP Physics C | 60 | 2% | 93% |
AP Psychology | 469 | 14% | 86% |
AP Spanish Language and Culture | 57 | 2% | 81% |
AP Statistics | 174 | 5% | 83% |
AP Studio Art-General Portfolio | <10 | 0% | 67% |
AP U.S. Government and Politics | 78 | 2% | 86% |
AP U.S. History | 219 | 6% | 86% |
AP World History | 93 | 3% | 88% |
Total | 3,390 | 100% | 86% |
2016-17 Number and Percentage of Virtual Enrollments with Pass Rate for AP CoursesNote: An additional 406 enrollments had a course type listed as Advanced Placement, but did not match an AP SCED Code. Similarly, there existed local course titles with AP in the title that did not have an AP SCED Code. Thus, it is very likely the data above underreports the number of students taking AP courses virtually.Table C8.
Subject Area | % City | % Not Specified | % Rural | % Suburb | % Town |
|---|---|---|---|---|---|
Agriculture, Food, and Natural Resources | 0% | 0% | 0% | 0% | 0% |
Architecture and Construction | 0% | 0% | 0% | 0% | 0% |
Business and Marketing | 1% | 1% | 2% | 2% | 1% |
Communication and Audio / Visual Technology | 0% | 1% | 0% | 0% | 0% |
Computer and Information Sciences | 2% | 1% | 2% | 3% | 2% |
Engineering and Technology | 1% | 2% | 0% | 0% | 2% |
English Language and Literature | 21% | 20% | 17% | 18% | 20% |
Fine and Performing Arts | 5% | 7% | 4% | 5% | 5% |
Foreign Language and Literature | 5% | 4% | 7% | 7% | 4% |
Health Care Sciences | 0% | 0% | 1% | 1% | 1% |
Hospitality and Tourism | 0% | 0% | 0% | 0% | 0% |
Human Services | 0% | 0% | 1% | 0% | 0% |
Life and Physical Sciences | 15% | 13% | 13% | 15% | 13% |
Manufacturing | 0% | 0% | 0% | 0% | 0% |
Mathematics | 18% | 16% | 16% | 18% | 16% |
Military Science | 0% | 0% | 0% | 0% | 0% |
Miscellaneous | 7% | 7% | 11% | 7% | 8% |
Nonsubject Specific | 0% | 0% | 0% | 3% | 0% |
Physical, Health, and Safety Education | 7% | 11% | 5% | 6% | 8% |
Public, Protective, and Government Services | 0% | 0% | 0% | 0% | 0% |
Religious Education and Theology | 0% | 0% | 0% | 0% | 0% |
Social Sciences and History | 17% | 15% | 18% | 16% | 16% |
Transportation, Distribution, and Logistics | 0% | 0% | 0% | 0% | 0% |
Total | 100% | 100% | 100% | 100% | 100% |
2016-17 Virtual Enrollments Percentage by Subject Area and LocaleTable C9.
Subject Area | City Pass Rate | Not Specified Pass Rate | Rural Pass Rate | Suburb Pass Rate | Town Pass Rate |
|---|---|---|---|---|---|
Agriculture, Food, and Natural Resources | 74% | 76% | 86% | 89% | 68% |
Architecture and Construction | NR | 96% | 93% | 47% | 90% |
Business and Marketing | 59% | 38% | 69% | 67% | 64% |
Communication and Audio / Visual Technology | 83% | 63% | 71% | 75% | 72% |
Computer and Information Sciences | 66% | 44% | 70% | 55% | 46% |
Engineering and Technology | 57% | 59% | 74% | 90% | 54% |
English Language and Literature | 50% | 48% | 56% | 53% | 50% |
Fine and Performing Arts | 53% | 60% | 65% | 58% | 55% |
Foreign Language and Literature | 59% | 42% | 66% | 61% | 57% |
Health Care Sciences | 85% | 72% | 83% | 83% | 71% |
Hospitality and Tourism | 79% | 98% | 77% | 79% | 57% |
Human Services | 50% | 100% | 87% | 76% | 57% |
Life and Physical Sciences | 50% | 47% | 59% | 55% | 52% |
Manufacturing | NR | NR | NR | NR | NR |
Mathematics | 49% | 48% | 51% | 50% | 44% |
Military Science | NR | NR | NR | NR | NR |
Miscellaneous | 36% | 37% | 66% | 58% | 50% |
Nonsubject Specific | 88% | NR | 72% | 99% | NR |
Physical, Health, and Safety Education | 52% | 55% | 68% | 62% | 60% |
Public, Protective, and Government Services | 74% | 87% | 76% | 82% | 73% |
Religious Education and Theology | NR | NR | 86% | 85% | 67% |
Social Sciences and History | 51% | 48% | 63% | 56% | 54% |
Transportation, Distribution, and Logistics | NR | NR | 97% | NR | NR |
Total | 51% | 49% | 61% | 57% | 52% |
2016-17 Virtual Enrollment Pass Rates by Subject Area and LocaleTable C10.
Subject Area | # of Male Enrolls | # of Female Enrolls | % of Male Enrolls | % of Female Enrolls | Male Pass Rate | Female Pass Rate |
|---|---|---|---|---|---|---|
Agriculture, Food, and Natural Resources | 174 | 407 | 0% | 0% | 72% | 79% |
Architecture and Construction | 205 | 39 | 0% | 0% | 83% | 95% |
Business and Marketing | 4,067 | 4,064 | 2% | 2% | 63% | 65% |
Communication and Audio / Visual Technology | 992 | 1,071 | 0% | 0% | 72% | 76% |
Computer and Information Sciences | 6,113 | 4,787 | 2% | 2% | 58% | 56% |
Engineering and Technology | 2,786 | 2,357 | 1% | 1% | 62% | 56% |
English Language and Literature | 49,668 | 48,281 | 19% | 18% | 51% | 54% |
Fine and Performing Arts | 12,482 | 13,294 | 5% | 5% | 53% | 61% |
Foreign Language and Literature | 13,526 | 16,092 | 5% | 6% | 56% | 64% |
Health Care Sciences | 1,008 | 2,423 | 0% | 1% | 79% | 82% |
Hospitality and Tourism | 285 | 399 | 0% | 0% | 72% | 73% |
Human Services | 249 | 1,032 | 0% | 0% | 86% | 75% |
Life and Physical Sciences | 37,351 | 36,318 | 15% | 14% | 52% | 55% |
Manufacturing | 53 | <16 | 0% | 0% | 91% | 100% |
Mathematics | 44,965 | 44,136 | 18% | 17% | 48% | 50% |
Military Science | 23 | 14 | 0% | 0% | 83% | 71% |
Miscellaneous | 19,577 | 20,745 | 8% | 8% | 51% | 55% |
Nonsubject Specific | 2,376 | 2,319 | 1% | 1% | 98% | 98% |
Physical, Health, and Safety Education | 17,459 | 18,131 | 7% | 7% | 58% | 60% |
Public, Protective, and Government Services | 621 | 914 | 0% | 0% | 74% | 80% |
Religious Education and Theology | 39 | 70 | 0% | 0% | 82% | 80% |
Social Sciences and History | 42,077 | 44,400 | 16% | 17% | 54% | 57% |
Transportation, Distribution, and Logistics | 101 | <16 | 0% | 0% | 95% | 93% |
Total | 256,197 | 261,273 | 100% | 100% | 53% | 57% |
2016-17 Number and Percentage of Virtual Enrollments with Pass Rates by Subject Area and GenderNote: < values are used as cell suppression techniques.Table C11.
Virtual Method | # of Enrolls | % of Enrolls | Pass Rate |
|---|---|---|---|
Blended Learning | 45,107 | 9% | 60% |
Digital Learning | 54,974 | 11% | 51% |
Online Course | 411,666 | 80% | 55% |
Missing | 5,723 | 1% | 56% |
Total | 517,470 | 100% | 55% |
2016-17 Number and Percentage of Virtual Enrollments with Pass Rate by Virtual Method
Appendix - D Student Tables
Note: Clicking on the orange hyperlinked table number will return to the section of the report that discusses the table.Table D1.
Grade Level | # of Students | % Change from 15-16 |
|---|---|---|
K | 580 | -3% |
1 | 757 | -3% |
2 | 811 | -2% |
3 | 901 | 8% |
4 | 909 | -4% |
5 | 1,169 | 13% |
6 | 1,730 | -3% |
7 | 2,567 | 3% |
8 | 3,322 | 4% |
9 | 14,858 | 10% |
10 | 18,916 | 11% |
11 | 22,166 | 14% |
12 | 33,586 | 15% |
Total | 101,359 | 12% |
2016-17 Number of Virtual Students with Percent Year over Year ChangeTable D2.
Virtual Type | # of Students | % of Students | # of Enrolls | % of Enrolls | Pass Rate |
|---|---|---|---|---|---|
Part-Time (Michigan Virtual) | 10,426 | 10% | 22,643 | 4% | 81% |
Part-Time (Non-Michigan Virtual) | 72,536 | 72% | 296,254 | 57% | 57% |
Full-Time (including Cybers) | 19,435 | 19% | 198,573 | 38% | 49% |
Total | 101,359 | 100% | 517,470 | 100% | 55% |
2016-17 Number and Percentage of Virtual Students and Enrollments with Pass Rate by Virtual TypeNote: Some students has enrollments across more than one virtual type and therefore appear in more than one row. However, the total number of students (101,359) is the unique student count. Table D3.
Virtual Type | Virtual Pass Rate | Non-Virtual Pass Rate |
|---|---|---|
Part-Time (Michigan Virtual) | 81% | 92% |
Part-Time (Non-Michigan Virtual) | 57% | 75% |
Full-Time (including Cybers) | 49% | NA |
Total | 55% | 78% |
2016-17 Pass Rate Comparison for Virtual Learners for Their Virtual and Non-Virtual Courses by Virtual TypeTable D4.
Gender | # of Students | % of Students | # of Enrolls | % of Enrolls | Pass Rate |
|---|---|---|---|---|---|
Males | 50,280 | 50% | 256,197 | 50% | 53% |
Females | 51,087 | 50% | 261,273 | 50% | 57% |
Total | 101,359 | 100% | 517,470 | 100% | 55% |
2016-17 Number and Percentage of Students and Virtual Enrollments with Pass Rate by GenderTable D5.
Race /Ethnicity | # of Students | % of Students | # of Enrolls | % of Enrolls | Pass Rate |
|---|---|---|---|---|---|
African American | 19,416 | 19% | 106,350 | 21% | 44% |
American Indian or Alaska Native | 899 | 1% | 4,190 | 1% | 59% |
Asian | 1,812 | 2% | 6,119 | 1% | 74% |
Hispanic or Latino | 7,186 | 7% | 38,979 | 8% | 51% |
Native Hawaiian or Pacific Islander | 95 | 0% | 470 | 0% | 58% |
Two or More Races | 4,057 | 4% | 26,778 | 5% | 49% |
Unknown | 515 | 1% | 1,762 | 0% | 42% |
White | 67,379 | 66% | 332,822 | 64% | 59% |
Total | 101,359 | 100% | 517,470 | 100% | 55% |
2016-17 Number and Percentage of Students and Virtual Enrollments with Pass Rates by Race/EthnicityTable D6.
Poverty Status | # of Students | % of Students | # of Enrolls | % of Enrolls | Pass Rate |
|---|---|---|---|---|---|
Yes | 55,055 | 54% | 323,395 | 62% | 48% |
No | 45,789 | 45% | 191,721 | 37% | 66% |
Unknown | 680 | 1% | 2,354 | 0% | 39% |
Total | 101,359 | 100% | 517,470 | 100% | 55% |
2016-17 Number and Percentage of Students and Virtual Enrollments with Pass Rate by Poverty StatusNote: The total number of students exceeds the 101,359 number because a few students had enrollments across multiple schools where one school listed the student under a specific poverty status, but the other school left the status unknown. The unique total was used to emphasize the true number of virtual students.Table D7.
Poverty Status | Virtual Pass Rate | Non-Virtual Pass Rate | Virtual Pass Rate - Non-Virtual Pass Rate |
|---|---|---|---|
Yes | 48% | 70% | -22% |
No | 66% | 86% | -20% |
Unknown | 39% | 47% | -8% |
Total | 55% | 78% | -23% |
2016-17 Pass Rate Comparison for Virtual Learners for Their Virtual and Non-Virtual Courses by Poverty StatusTable D8.
Virtual Type | % of Virtual Learners in Poverty | % of Virtual Enrolls from Learners in Poverty | Pass Rate for Virtual Learners in Poverty |
|---|---|---|---|
Part-Time (Michigan Virtual) | 24% | 25% | 69% |
Part-Time (Non-Michigan Virtual) | 54% | 58% | 50% |
Full-Time (including Cybers) | 72% | 73% | 46% |
Total | 54% | 62% | 48% |
2016-17 Percentage of Virtual Learners and Virtual Enrollments in Poverty with Pass Rate by Virtual TypeTable D9.
Seat Time Waiver Status | # of Students | % of Students | # of Enrolls | % of Enrolls | Pass Rate |
|---|---|---|---|---|---|
Yes | 17,946 | 18% | 148,128 | 29% | 48% |
No | 83,894 | 83% | 366,988 | 71% | 58% |
Unknown | 680 | 1% | 2,354 | 0% | 39% |
Total | 101,359 | 100% | 517,470 | 100% | 55% |
2016-17 Number and Percentage of Students and Virtual Enrollments with Pass Rate by Seat Time Waiver StatusNote: The total number of students exceeds the 101,359 number because a few students had enrollments across multiple schools where one school listed the student under a specific seat time waiver status, but the other school left the status unknown. The unique total was used to emphasize the true number of virtual students.Table D10.
Non-Virtual Performance | # of Students | % of Students | # of Virtual Enrolls | % of Virtual Enrolls | Pass Rate |
|---|---|---|---|---|---|
Passed All NV Courses | 31,113 | 47% | 79,297 | 42% | 85% |
Did Not Pass 1 or 2 NV Courses | 15,643 | 24% | 46,673 | 24% | 60% |
Did Not Pass 3 or More NV Courses | 19,494 | 29% | 64,814 | 34% | 38% |
Total | 66,250 | 100% | 190,784 | 100% | 63% |
2016-17 Number and Percentage of Students and Virtual Enrollments with Pass Rates by Non-Virtual Performance (Minimum of 3 Non-Virtual Enrollments)Table D11.
Non-Virtual Performance | # of MV Enrolls | MV Pass Rate | # of Non-MV Enrolls | Non-MV Pass Rate |
|---|---|---|---|---|
Passed All NV Courses | 13,743 | 90% | 65,554 | 84% |
Did Not Pass 1 or 2 NV Courses | 3,778 | 76% | 42,895 | 58% |
Did Not Pass 3 or More NV Courses | 2,802 | 49% | 62,012 | 38% |
Total | 20,323 | 82% | 170,461 | 61% |
2016-17 Number of Virtual Enrollments with Pass Rates by Non-Virtual Performance (Minimum of 3 Non-Virtual Enrollments) or Part-Time TypesTable D12.
Virtual Course Performance | # of Students | % of Students | # of Enrolls | % of Enrolls |
|---|---|---|---|---|
Passed All | 49,006 | 48% | 159,550 | 31% |
Passed Some, But Not All | 27,330 | 27% | 246,237 | 48% |
Didn't Pass Any | 25,023 | 25% | 111,683 | 22% |
Total | 101,359 | 100% | 517,470 | 100% |
2016-17 Number and Percentage of Students and Virtual Enrollments by Virtual Course PerformanceTable D13.
# of Virtual Courses Not Passed | # of Students | % of Students |
|---|---|---|
1 to 2 | 11,583 | 46% |
3 to 4 | 3,946 | 16% |
5 to 6 | 3,793 | 15% |
7 to 8 | 2,136 | 9% |
9 to 10 | 794 | 3% |
11+ | 2,771 | 11% |
Total | 25,023 | 100% |
2016-17 Number and Percentage of Virtual Students Who Did Not Pass Any Virtual Courses by the Number of Virtual Courses They TookTable D14.
Virtual Usage | # of Students | % of Students | # of Virtual Enrolls | % of Virtual Enrolls | Pass Rate |
|---|---|---|---|---|---|
1 to 2 Virtual Courses | 48,016 | 47% | 68,065 | 13% | 73% |
3 to 4 Virtual Courses | 14,425 | 14% | 50,136 | 10% | 58% |
5 or More Virtual Courses | 38,918 | 38% | 399,269 | 77% | 51% |
Total | 101,359 | 100% | 517,470 | 100% | 55% |
2016-17 Number and Percentage of Students and Virtual Enrollments with Pass Rates by Virtual UsageTable D15.th
Assessment Measure | Virtual Pass Rate | State Pass Rate |
|---|---|---|
Evidence-Based Reading & Writing (SAT) | 47% | 60% |
Mathematics (SAT) | 25% | 37% |
Science (M-STEP) | 27% | 34% |
Social Science (M-STEP) | 37% | 46% |
2016-17 Comparison of Virtual and State Pass Rates on 11 Grade State Assessment MeasuresNote: Statewide data for SAT was available from the MI School Data Portal. Table D16.
Assessment | Pass All NV Pass Rate | Did Not Pass 1 or 2 NV Pass Rate | Did Not Pass 3 or More NV Pass Rate |
|---|---|---|---|
Evidence-Based Reading & Writing (SAT) | 67% | 44% | 25% |
Mathematics (SAT) | 42% | 22% | 8% |
Science (M-STEP) | 40% | 23% | 11% |
Social Science (M-STEP) | 52% | 32% | 19% |
2016-17 State Assessment Proficiency Rates for Virtual Learners with Three or More Non-Virtual Enrollments by Non-Virtual PerformanceTable D17.
Assessment | Virt. Learners in Poverty | Virt. Learners Not in Poverty | All Virtual Learners |
|---|---|---|---|
Evidence-Based Reading & Writing (SAT) | 31% | 63% | 47% |
Mathematics (SAT) | 12% | 38% | 25% |
Science (M-STEP) | 15% | 37% | 27% |
Social Science (M-STEP) | 23% | 49% | 37% |
2016-17 State Assessment Proficiency Rates for Virtual Learners by Poverty StatusTable D18.
Assessment | Virt. Learners With STW | Virt. Learners W/O STW | All Virtual Learners |
|---|---|---|---|
Evidence-Based Reading & Writing (SAT) | 32% | 49% | 47% |
Mathematics (SAT) | 9% | 28% | 25% |
Science (M-STEP) | 14% | 28% | 27% |
Social Science (M-STEP) | 25% | 39% | 37% |
2016-17 State Assessment Proficiency Rates for Virtual Learners by Seat Time Waiver StatusTable D19.
Assessment | Part-Time (MV) | Part-Time (Non-MV) | Full-Time (w/Cybers) | All Virtual |
|---|---|---|---|---|
Evidence-Based Reading & Writing (SAT) | 79% | 43% | 40% | 47% |
Mathematics (SAT) | 54% | 22% | 13% | 25% |
Science (M-STEP) | 48% | 23% | 18% | 27% |
Social Science (M-STEP) | 62% | 33% | 31% | 37% |
2016-17 State Assessment Proficiency Rates for Virtual Learners by Virtual TypeTable D20.
Assessment | Pass All MV | Pass All Non-MV | Fail 1 or 2 MV | Fail 1 or 2 Non-MV | Fail 3+ MV | Fail 3+ Non-MV |
|---|---|---|---|---|---|---|
Evidence-Based Reading & Writing (SAT) | 85% | 61% | 73% | 39% | 50% | 23% |
Mathematics (SAT) | 61% | 37% | 45% | 18% | 30% | 7% |
Science (M-STEP) | 54% | 36% | 40% | 20% | 29% | 10% |
Social Science (M-STEP) | 68% | 48% | 53% | 29% | 41% | 17% |
2016-17 State Assessment Proficiency Rates for Virtual Learners by Part-Time Type and Non-Virtual Performance
Appendix – E Wild Cards Search Criteria
Wild-Card Search Criteria for Michigan Virtual
‘%MI Virtual%’, ‘%Mich Virt%’, ‘%MIVHS%’, ‘%MIVS%’, ‘%MVS%’, ‘%MVU%’, ‘%VH’, ‘%MVHS%’, ‘%MIVU%’, ‘%VHS%’, ‘MV%’, ‘%MV’, ‘%Michigan Virtual%’, ‘%IS: MV%’, ‘%IS:MV%’, ‘%MI Virt%’, ‘%MV HS%’, ‘Virtual HS%’, and ‘Mich. Virtual High School%’
Wild-Card Search Criteria for Common Third Party Providers
‘%Apex%’, ‘APX%’, ‘%Aventa%’, ‘%BYU%’, ‘%Brigham%’, ‘%Compass%’, ‘%Edgen%’, ‘%2020%’, ‘%20/20%’, ‘%20-20%’, ‘%E20%’, ‘%Edison%’, ‘%FLVS%’, ‘%FVS%’, ‘%GenNet%’, ‘%Gen Net%’, ‘%K12 Virtual%’, ‘%K12:%’, ‘%K12vs%’, ‘%Lincoln Int%’, ‘%Little Lincoln%’, ‘%- Lincoln%’, ‘%(Lincoln)%’, ‘%Lincoln’, ‘%UNL%’, ‘%Middlebury%’, ‘%Nova net%’, ‘%Novanet%’, ‘%Odyssey%’,‘%Odware%’, ‘ODY%’, ‘%(OD%’, ‘%Edmentum%’, and ‘%Plato%’
Wild-Card Search Criteria for Common Generic Labels for Online or Virtual Learning
‘%Online%’, ‘%On-line%’, ‘%On line%’, ‘%onl’, ‘%onli’, ‘%onlin’, ‘%- OL’, ‘%-OL’, ‘%O/L%’, ‘OL %’, ‘%STW%’, ‘%E-Learn%’, ‘%E-LRN%’, ‘%Virtual%’, ‘%- virt%’, and ‘%- DL’