Table of Contents IntroductionSchoolsCoursesStudentsState AssessmentsMapsConclusionAppendix A - MethodologyAppendix - B School Tables
Table B1. 2018-19 Count and Pass Rate of K-12 Virtual Enrollments by Grade Level
Table B3. 2018-19 Number and Percentage of Schools by School Pass Rate
Table B4. 2018-19 Number and Percentage of Schools and Virtual Enrollments by Entity Type
Table B6. 2018-19 Number and Percentage of Full-Time (FT) Virtual or Cyber Schools
Table B8. 2018-19 Number and Percentage of Schools with Part-Time (PT) Virtual Schools
Table B10. 2018-19 Number and Percentage of Schools and Virtual Enrollments by School Emphasis
Table B14. 2018-19 Percentage of Schools by Ratio of Virtual Courses to Student and School Pass Rate
Table B15. 2018-19 Number and Percentage of Schools and Virtual Enrollments by Locale
Table B18. 2018-19 Percentage of Schools with Virtual Enrollments by Building Pass Rate and Locale
Table C1. 2018-19 Number and Percentage of Virtual Enrollments with Pass Rate by Subject Area
Table C8. 2018-19 Virtual Enrollment Percentage by Subject Area and Locale
Table C9. 2018-19 Virtual Enrollment Pass Rates by Subject Area and Locale
Table C11. 2018-19 Number and Percentage of Virtual Enrollments with Pass Rate by Virtual Method
Table D1. 2018-19 Number of Virtual Students with Percent Year over Year Change
Table D9. 2018-19 Pass Rate Comparison for Full- and Part-Time Virtual Learners
Appendix - E State Assessment Tables
Table E1. 2018-19 Comparison of Virtual and State Pass Rates on 11th Grade State Assessment Measures
Table E3. 2018-19 State Assessment Proficiency Rates for Virtual Learners by Poverty Status
Table E4. 2018-19 State Assessment Proficiency Rates for Virtual Learners by Virtual Type
Appendix - F Completion Status Tables
Table F1. 2018-19 Number and Percentage of Virtual Enrollments by Completion Status
Table F2. 2018-19 Percentage of Virtual Enrollments by Completion Status and Entity Type
Table F3. 2018-19 Number and Percentage of Full-Time Virtual Enrollments by Completion Status
Table F4. 2018-19 Number and Percentage of Part-Time Virtual Enrollments by Completion Status
Table F5. 2018-19 Percentage of Virtual Enrollments by Completion Status and School Emphasis
Table F6. 2018-19 Percentage of Virtual Enrollments by Completion Status and Core Subject Area
Table F7. 2018-19 Percentage of Virtual Enrollments by Completion Status and Student Sex
Table F8. 2018-19 Percentage of Virtual Enrollments by Completion Status and Race / Ethnicity
Table F9. 2018-19 Percentage of Virtual Enrollments by Completion Status and Poverty Status
Past Effectiveness Reports Michigan’s K-12 Virtual Learning Effectiveness Report 2017-18Michigan’s K-12 Virtual Learning Effectiveness Report 2016-17Michigan’s K-12 Virtual Learning Effectiveness Report 2015-16Michigan’s K-12 Virtual Learning Effectiveness Report 2014-15Michigan’s K-12 Virtual Learning Effectiveness Report 2013-14Michigan’s K-12 Virtual Learning Effectiveness Report 2010-11 to 2012-13View Infographic Download PDF Version Watch Report Overview
Introduction
This report presents analysis of information on virtual learners reported by schools to the state and shares findings in a highly consumable way to aid the evaluation of virtual learning programs. This year’s report is the seventh edition of this annual publication. Past reports are available through the Michigan Virtual website. The report is organized into several sections. The first section looks at schools as the unit of analysis. The next section focuses on the virtual courses taken. The third section focuses on students. The fourth section captures performance on statewide assessments. There is also a brief section containing maps of virtual use. Each section is meant to capture the essential findings without being overly data intensive; however, data tables have been included in the appendices to provide those interested with more in-depth information. Information about the report’s methodology is captured in Appendix A. Please note that in some tables and figures, the percentage data may not sum to 100% due to rounding.
Schools
Fast Facts
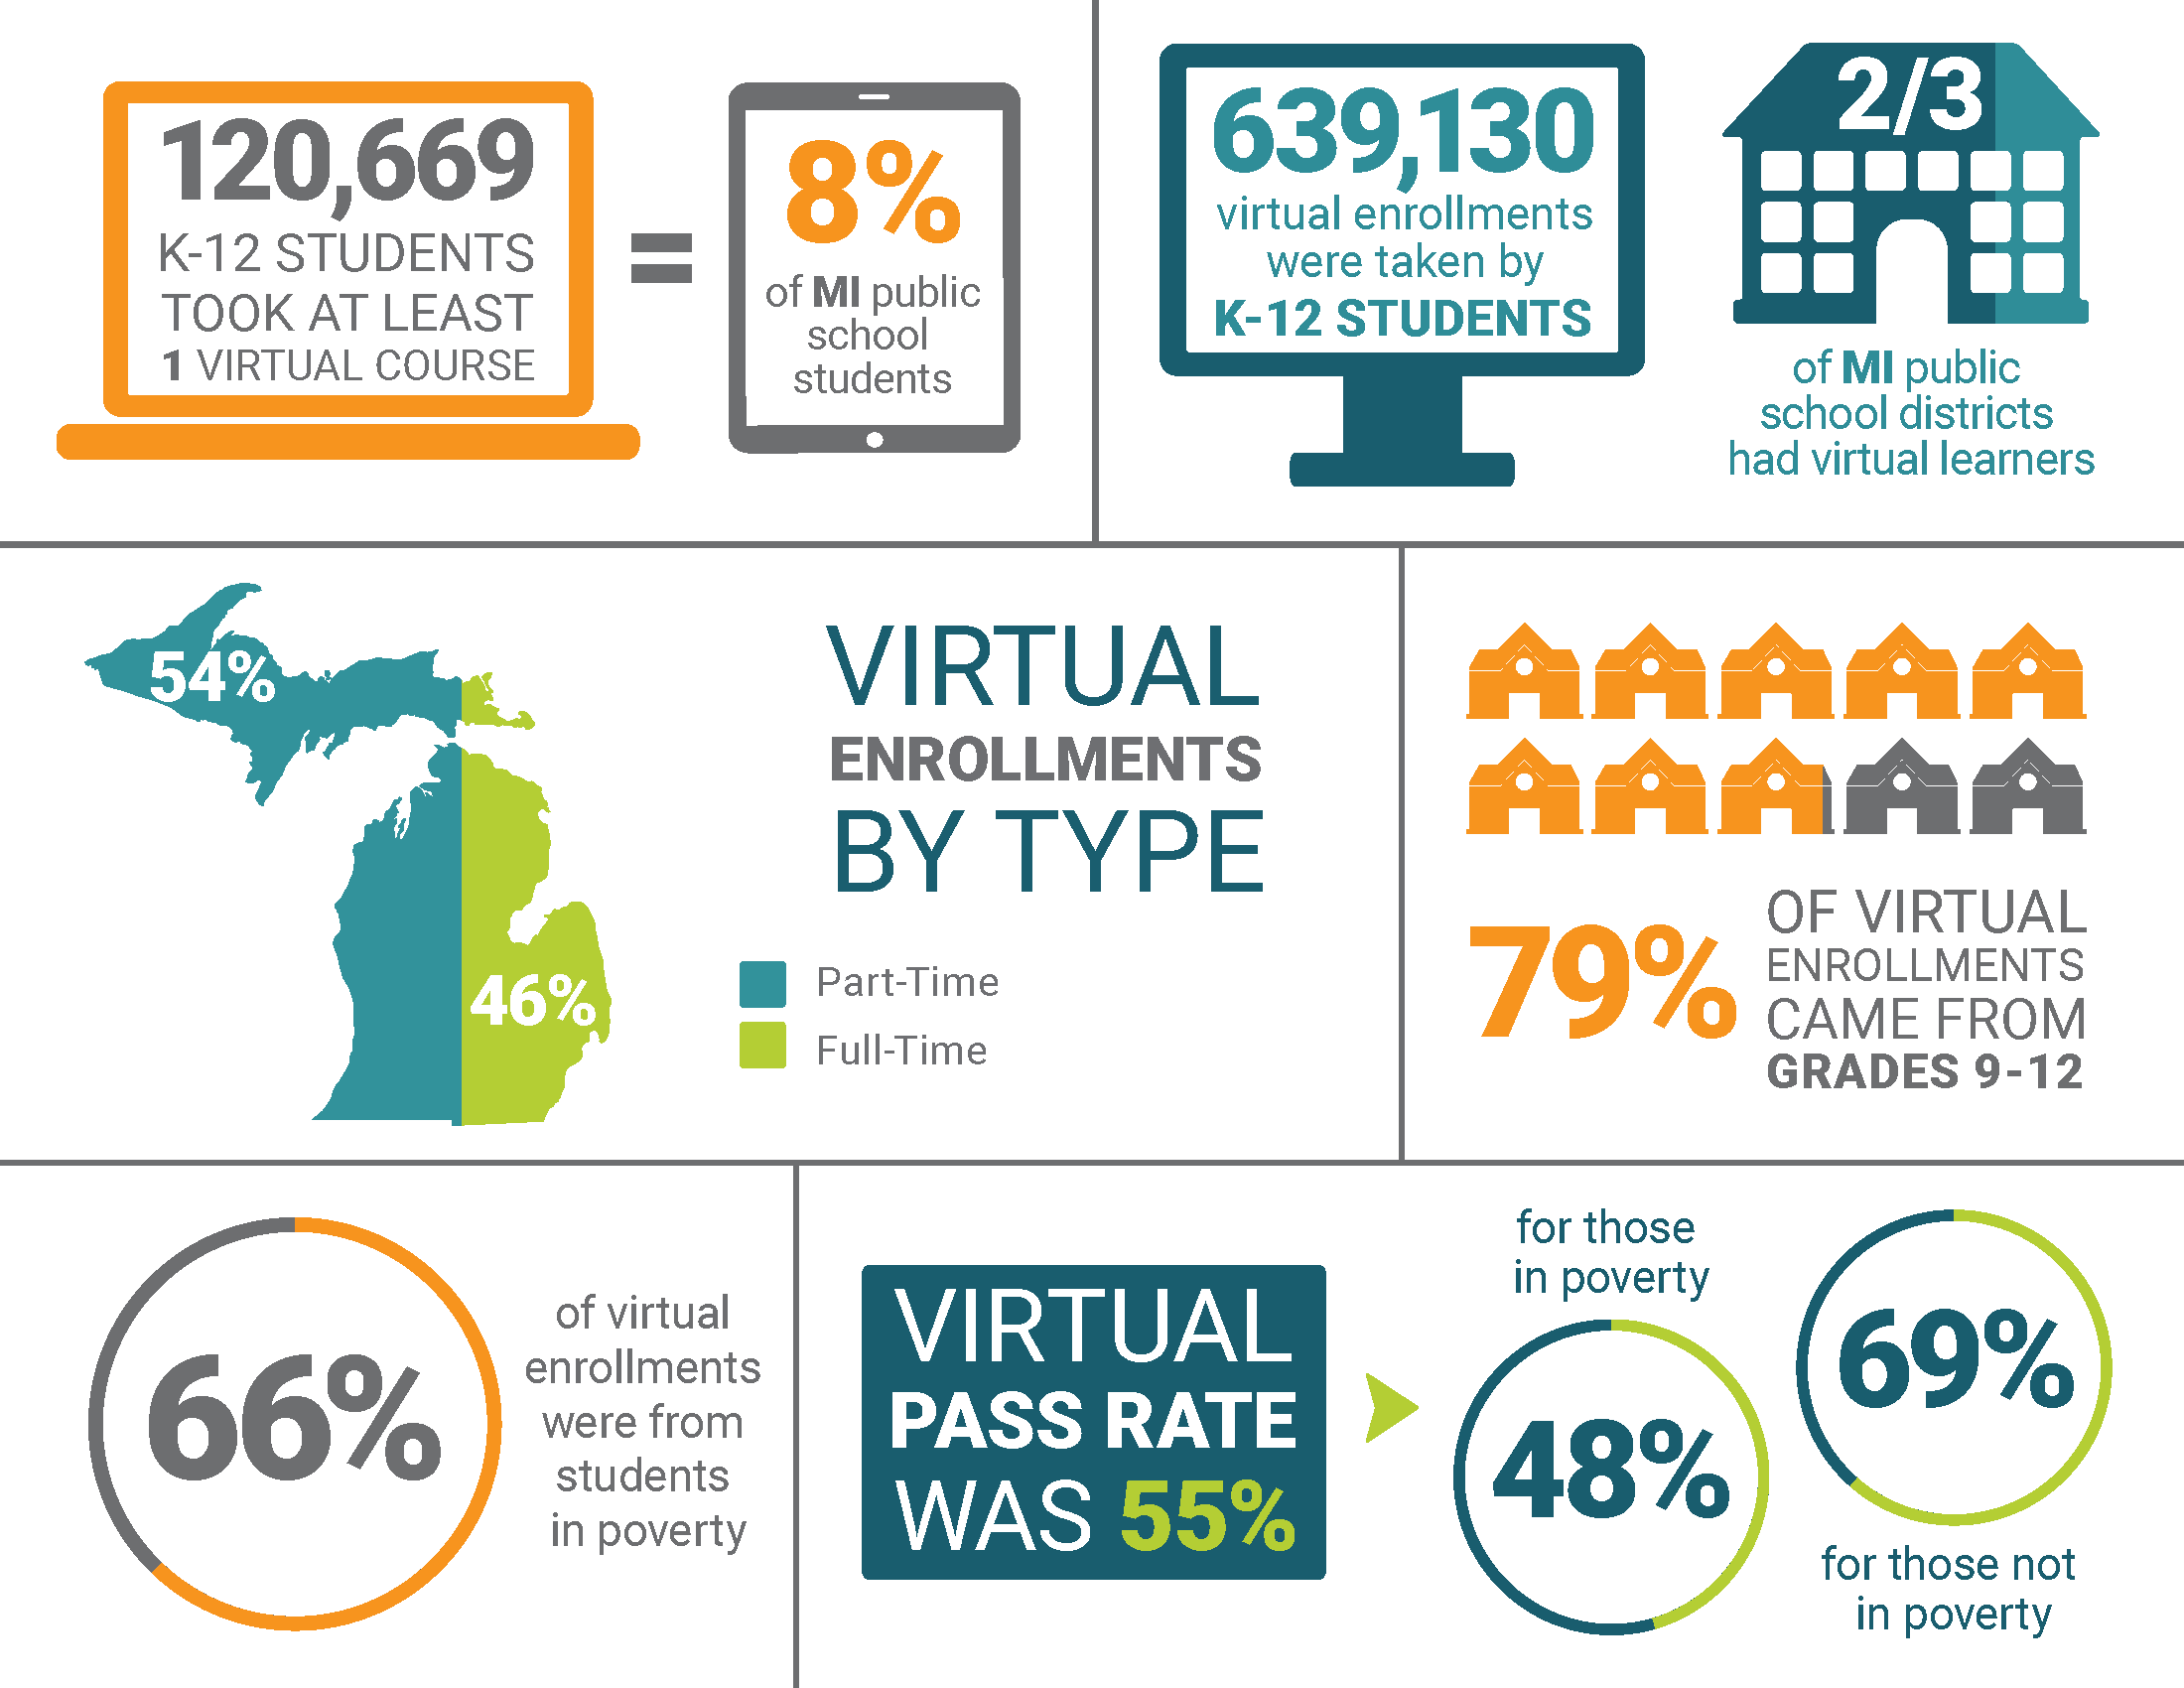
608 school districts reported at least one virtual enrollment. This represents two-thirds of Michigan school districts.
Over half of the 1,225 schools with virtual enrollments had 100 or more virtual enrollments.
75% of schools with virtual enrollments had a general education school emphasis; 24% had an alternative education emphasis.
88% of schools with virtual learning were LEA schools.
LEA schools accounted for 58% of the virtual enrollments; PSA schools generated 39% of the virtual enrollments.
54% of virtual enrollments came from schools with part-time virtual learning options.
LEA schools had the most full-time virtual schools (59).
98% of virtual enrollments came from schools with 100 or more virtual enrollments.
About 79% of virtual enrollments came from students in grades 9-12.
31% of virtual enrollments came from suburban schools, the most of any locale.
Schools with a general education emphasis had a 65% virtual pass rate, outperforming those with an alternative education emphasis, which had a pass rate of 42%.
26% of schools had a school-wide virtual pass rate of 90% to 100%.
Number of Districts
For the 2018-19 school year, 608 districts reported having at least one virtual enrollment. This represented over two-thirds of the 905 Michigan public school districts for the year. See the MI School Data Report for a breakdown of the district count. Within those districts, 1,225 schools reported virtual enrollments, an increase of 67 schools from the prior year.
By Grade Level
Across the 1,225 schools, 639,130 virtual enrollments were taken. Students in 12th grade enrolled in the most virtual courses (178,058), representing approximately 28% of all virtual enrollments. The overall pass rate for virtual enrollments was 55%, the same as the prior two years. See Table F1 for a more specific breakdown of all the completion statuses. This ranged from a high of 74% in kindergarten to a low of 41% in 9th grade. See Table B1 for more information. Consistent with findings from previous years, virtual learners passed their virtual courses at a lower rate (55%) than they passed their non-virtual courses (76%). This gap is smaller than the past year due to the non-virtual pass rate for students dropping from 79% to 76%. See Table B2.
By School-Level Virtual Pass Rate
Of the 1,225 schools with virtual enrollments, 316 or 26% had school-level virtual pass rates of 90% to 100%. A little more than half of schools had virtual pass rates of 70% or better. See Table B3.
By Entity Type
LEA schools (58%) and PSA schools (39%) accounted for almost all the virtual enrollments. Virtual enrollments came from 1,072 (88%) LEA schools while only 110 (9%) of the schools were PSAs. See Table B4. LEA schools had a higher pass rate (58%) than PSA schools (49%). See Table B5 or, for a more in-depth look at the completion statuses, see Table F2.
By Full-Time Virtual Schools
The number of full-time virtual schools was up from 70 to 79 in 2018-19. Fifty-nine of the 79 full-time virtual schools (75%) were LEA schools. PSA schools accounted for 20% of the full-time virtual schools. See Table B6. Close to 40% of students attending full-time virtual schools did so at LEA schools with about 60% attending a PSA school. The pass rates between these two entity types were fairly close with full-time virtual LEA schools at 51% and PSA schools at 49%. See Table B7 and Table F3. In total, 46% of virtual enrollments came from cyber or full-time virtual schools – three percent higher than last year.
By Part-Time Virtual Schools
About 94% of the schools offering virtual learning do so to supplement their face-to-face course offerings. These 1,146 schools, referred to in this report as part-time virtual schools, were predominantly LEA schools (88%). See Table B8. Eighty-six percent of the part-time virtual students were enrolled through LEA schools and 10% through PSA schools. LEA schools accounted for over 275,000 virtual enrollments or 80% of the part-time enrollments. In total, part-time virtual enrollments accounted for 54% of all the virtual enrollments for the year. LEA schools had a pass rate of 61% whereas PSA schools had a pass rate of 50%. Overall, the pass rates for the part-time virtual schools (60%) was over 10 percentage points higher than the rate for the full-time virtual schools (49%). See Table B9 and Table F4.
By School Emphasis
Three out of four schools with virtual learning were designated as General Education and produced 357,347 (56%) of the virtual enrollments. Schools with Alternative Education as their emphasis accounted for 277,894 (43%) of the virtual enrollments. See Table B10. There was a considerable difference in virtual pass rates between these two types of schools. General Education schools had a 65% virtual pass rate, whereas Alternative Education schools had a 42% virtual pass rate (see Table B11 and Table F5), though this varied by entity type. LEA schools, for instance, had a 74% virtual pass rate for General Education schools and a 44% virtual pass rate for Alternative Education schools. See Table B12.
By Number of Virtual Enrollments
Over half of schools with virtual enrollments (55%) had 100 or more virtual enrollments. These schools were responsible for 98% of the virtual enrollments. As has been observed in previous years, schools with less than 10 virtual enrollments were the next highest percentage of schools with 18%; however, they only generated .1% of the virtual enrollments. See Table B13. Another trend that continued was that, in general, schools with fewer virtual enrollments per student performed better. Consider, for instance, that 36% of schools with an average of one to two virtual enrollments per virtual learner had a virtual pass rate of 90% to 100%, whereas only 15% of schools with an average of four or more virtual courses per virtual learner had a 90% to 100% pass rate. See Table B14.
By Locale
Rural schools represented about 34% of schools with virtual enrollments. Suburban settings provided the second most schools with 31%. Suburban schools, however, tallied the largest percentage of the virtual enrollments at 31%. All four locales had more than 100,000 virtual enrollments. See Table B15. In each of the four locales, schools with 100 or more virtual enrollments accounted for the largest percentage of schools. Similarly, schools with less than 25 virtual enrollments was the second most likely scenario. See Table B16. Virtual pass rates varied by locale with suburban schools having the highest virtual pass rate at 60% and those not specified having the lowest at 50%. Both city schools (16%) and those not specified (27%) had the highest percentage of schools with pass rates less than 20%. See Tables B17 and B18.
Courses
Fast Facts
639,130 virtual enrollments were taken by Michigan K-12 students; the overall pass rate for virtual enrollments was 55%.
Virtual enrollments were spread across 931 different course titles.
66% of virtual enrollments occurred in the core subject areas of English Language and Literature, Mathematics, Life and Physical Sciences, and Social Sciences and History.
The course titles with the highest enrollments for each core subject were:
English Language and Literature: English 9, English 10, English 11, and English 12
Mathematics: Geometry, Algebra II, Algebra I, and Consumer Math
Life and Physical Sciences: Biology, Chemistry, Earth Science, and Physical Science
Social Sciences and History: U.S. History—Comprehensive, Economics, World History and Geography, World History—Overview
The virtual pass rates for each core subject were:
English Language and Literature: 51%
Mathematics: 49%
Life and Physical Sciences: 51%
Social Sciences and History: 55%
29 different Advanced Placement (AP) courses were taken virtually.
The percentage of enrollments was fairly consistent by subject area across rural, town, suburban, and city schools.
Online courses (defined as including a teacher in the virtual environment) produced 82% of the virtual enrollments. Digital learning (without a teacher in the virtual environment) and blended learning (some virtual, some face-to face instruction) each accounted for about 9% and 8% of the virtual enrollments, respectively.
Number of Courses
The 639,130 virtual enrollments came from 931 different course titles, as determined by unique SCED codes.
Courses by Subject Area
English Language and Literature was the subject area with the highest virtual enrollment with 119,337 enrollments – 19% of all virtual enrollments. Mathematics, Social Sciences and History, and Life and Physical Sciences were the other subject areas with 10% or more of the virtual enrollments. In high enrollment subject areas (greater than 25,000 virtual enrollments), virtual pass rates varied from a low of 49% in Mathematics to a high of 65% for Miscellaneous. See Table C1 and Table F6. The virtual pass rates were consistently lower than the non-virtual pass rate for the virtual learners in their non-virtual courses, a trend observed in past years. See Table C2.
Highest Virtual Enrollment Courses
For English Language and Literature, the most highly enrolled in virtual courses were 9th, 10th, 11th, and 12th grade English/Language Arts. Of those four, the pass rate was lowest for 9th grade English/Language Arts (39%) and consistently rose for each subsequent grade level to finish at 55% for 12th grade English/Language Arts. See Table C3. In Mathematics, Geometry, Algebra II, and Algebra I were the virtual courses with the highest enrollments. The pass rate across the top 10 most enrolled-in virtual mathematics courses ranged from a low of 35% for Algebra I to a high of 64% for Consumer Math. See Table C4. Biology, Chemistry, and Earth Science were the three course titles responsible for more than 10% of the virtual enrollments in Life and Physical Sciences courses. A quarter of all Life and Physical Sciences virtual courses were taken in Biology. Biology also had the lowest pass rate (42%) of those in the top 10; the highest was Science (grade 8) at 62%. See Table C5. For Social Sciences and History, the four course titles of U.S. History–Comprehensive, Economics, World History and Geography, and World History–Overview each yielded more than 10% of the virtual enrollments. Pass rates for the top 10 most enrolled in courses ranged from a low of 41% in World History and Geography to a high of 65% for Psychology. See Table C6. Twenty-nine AP courses were taken virtually in 2018-19. AP Psychology was the most popular course accounting for 22% of the 3,742 AP enrollments. The pass rate for AP courses taken virtually was 84%. See Table C7. The pass rate for non-virtual AP courses taken by virtual learners was 93%.
Subject Area Enrollments by Locale
Course enrollment patterns were consistent across locales. For instance, Mathematics represented between 16% and 18% of the virtual enrollments for all (rural, town, suburban, city, and not specified) locales. The range was also 3% (11% to 14%) for Life and Physical Sciences and 7% in English Language and Literature. See Table C8. Pass rates in virtual courses also varied across subject areas and locale. For instance, in English Language and Literature, pass rates fell between 39% for not specified schools to 56% for suburban schools. In Mathematics, pass rates ranged from 35% (not specified) to 53% (suburban). See Table C9.
Subject Area Enrollments by Student Sex
Males and females enrolled in subject areas in similar proportions. In the four highest enrollment subject areas (English Language and Literature, Mathematics, Life and Physical Sciences, and Social Sciences and History), the proportion of enrollment from males and females was within one percent of each other. Pass rates did, however, show more variability by student sex; in most cases, females outperformed males – a trend that has been consistent with past years. See Table C10.
Courses by Virtual Method
Schools classified the virtual courses into one of three methods: Blended Learning, Digital Learning, or Online Learning. See page 402 of the Michigan Student Data System Collection Details Manual Version 1.0.
Blended Learning - A hybrid instructional delivery model where pupils are provided content, instruction, and assessment at a supervised educational facility where the pupil and teacher are in the same physical location and in part through internet-connected learning environments with some degree of pupil control over time, location, and pace of instruction. For a course to be considered blended, at least 30% of the course content is delivered online.
Digital Learning - A course of study that is capable of generating a credit or a grade that is provided in an interactive internet-connected learning environment that does not contain an instructor within the online environment itself. There may be a teacher of record assigned to the course, but this teacher does not provide instruction to students through the online environment. For a course to be considered online as opposed to blended, all (or almost all) the course content is delivered online.
Online Course - A course of study that is capable of generating a credit or a grade that is provided in an interactive internet-connected learning environment, where pupils are separated from their teachers by time or location, or both. For a course to be considered online as opposed to blended, all (or almost all) the course content is delivered online.
Blended Learning enrollments accounted for 8% of the virtual enrollments and had a pass rate of 49%. Digital Learning totaled 9% of the enrollments with a 54% pass rate. Online courses represented the majority of the enrollments (82%) and yielded a pass rate of 55%. See Table C11.
Students
Fast Facts
120,669 K-12 students took at least one virtual course which represented 8% of Michigan public school students.
85% of virtual learners were in high school; 33% were seniors and 21% were juniors.
49% of virtual learners passed all their virtual courses. Twenty-three percent of virtual learners did not pass any of their virtual courses.
Of the 27,663 students who did not pass any of their virtual courses, 41% took only one or two courses. Over 12,550 students took and did not pass five or more virtual courses with 3,778 students taking and not passing 11 or more virtual courses.
Female students had a higher pass rate (57%) than did males (53%).
Students in poverty made up the majority of virtual learners (57%) and virtual enrollments (66%). Students in poverty also had a lower pass rate (48% v. 69%).
Part-time virtual learners had higher pass rates (60%) compared to full-time virtual learners (49%). This also included student in poverty (52% v. 43%).
Students using special education services made up 11% of the virtual learners.
Pass rates were higher for students taking fewer virtual courses. Students taking one or two virtual courses had a 76% pass rate compared to 51% for those taking five or more.
White students represented 68% of virtual students; African-Americans were 17%.
By Grade Level
For the 2018-19 school year, 120,669 Michigan K-12 students, approximately 8% of students in the state, took at least one virtual course. This was a 7% increase in the number of virtual learners compared to what was reported for 2017-18. Only about 7% of the state’s virtual learners were in grades K-5. Grades 6-8 were responsible for about 9% of the virtual learners. High school grade levels generated 85% of the virtual learners. About 33% of virtual learners were high school seniors and 21% were juniors. See Table D1.
By Student Sex
There were slightly more females (61,089) enrolled in virtual courses than males (59,593), though from a percentage perspective, each represented about half of the population. Females had a 4% higher pass rate (57% compared to males at 53%), continuing the trend seen in past years of females outperforming their male counterparts on this measure. See Table D2 and Table F7.
By Race/Ethnicity
White students made up 68% of virtual students with African American students totaling the second highest percentage with 17%. Asian students had the only pass rate (76%) above 60%. See Table D3 and Table F8.
By Poverty Status
Fifty-seven percent of virtual learners were classified as living in poverty. This is about 7% higher than the percentage of K-12 students statewide who were eligible for free or reduced lunch (50%) in the fall of 2018. See the Fall State Free and Reduced Lunch Count file for the 2018-19 school year. Students living in poverty took 66% of the virtual enrollments for the year. This is the same percentage as the prior year. The pass rate for students in poverty (48%) was 21 percentage points lower than students who were not in poverty (69%). See Table D4 and Table F9. In addition to the performance gap between those in poverty and those not in poverty, there were also differences in non-virtual pass rates. Virtual learners in poverty had a 68% pass rate in their non-virtual courses, 20 percentage points better than their virtual pass rate. Interestingly, students not in poverty had an 85% pass rate in their non-virtual courses, an improvement of 16 percentage points over their virtual pass rate. Thus, students in poverty had a larger performance gap between their virtual and non-virtual pass rates than did students who were not in poverty. See Table D5. Differences were apparent by virtual type. Sixty-seven percent of full-time virtual learners were in poverty compared to 54% of part-time virtual learners. The pass rate for full-time virtual learners in poverty was 43% compared to 52% for part-time virtual learners. See Table D6.
By Special Education Status
Students using special education services made up 11% of the virtual learners and 13% of the virtual enrollments. These percentages are somewhat similar to the statewide percentage of students using special education services (13.3%) for the 2018-19 school year. See the 2018-19 Special Education Data Portraits: Disability Snapshot. Students using special education services had a virtual pass rate of 48% compared to 56% for those who did not. See Table D7 and Table F10.
By Full-Time or Part-Time
About a quarter of students (31,176) were enrolled in cyber or full-time virtual schools. Students in these schools accounted for 295,234 or 46% of the virtual enrollments for the year. The pass rate for full-time virtual students was 49%. Three out for four virtual learning students are part-time virtual learners, taking some courses virtually to supplement their face-to-face schedule. This subset made up 54% of the virtual enrollments and had a pass rate of 60%. See Table D8. This rate is about 16% lower than their pass rate in face-to-face courses (76%). See Table D9.
By Non-Virtual Course Performance
Part-time virtual learners with at least three non-virtual courses were classified into one of three categories based on their success in those non-virtual courses. The three categories were:
Passed all Non-Virtual Courses
Did Not Pass 1 or 2 Non-Virtual Courses
Did Not Pass 3 or More Non-Virtual Courses
In total, 62% of virtual learners had at least three or more non-virtual enrollments. Of that group, 47% of students passed all their non-virtual courses, 19% did not pass one or two, and 34% did not pass three or more. There were clear differences in virtual pass rates between the three categories. Students passing all of their non-virtual courses had an 82% virtual pass rate. Students who did not pass one or two non-virtual courses had a virtual pass rate of 67%, and those with the lowest non-virtual success had a virtual pass rate of only 39%. See Table D10.
By Virtual Course Performance
Forty-nine percent of virtual learners passed every virtual enrollment they took. Twenty-three percent did not pass any of their virtual enrollments, and 28% passed some, but not all of their virtual enrollments. Students who passed all of their virtual courses were responsible for 31% of the virtual enrollments. Students with mixed success generated 48% of the enrollments, and students who did not pass any of their virtual courses contributed 21% of the virtual enrollments. These statistics are remarkably similar to last year. See Table D11.For the students who did not pass any of their virtual courses, 41% only took one or two virtual courses. On the other hand, 12,559 students did not pass five or more virtual courses, and a staggering 3,778 students did not pass 11 or more virtual courses. Further analysis of students failing all of their 11 or more virtual courses showed 87% of these students had a single school report data for them. Over 2,500 of these students were primarily or exclusively enrolled through full-time virtual programs. Over 560 students were using special education services (15%) and slightly fewer than 3,100 of these students (81%) were in poverty. See Table D12 and Table F11.What Table F11 makes clear is that for students who do not pass any of their virtual enrollments, “withdrawns” and “incompletes” were rampant. For the virtual enrollments from students who did not pass any of their virtual enrollments, 47% had a “Withdrawn” status (exited, failing, or passing) and another 20% were classified as “Incomplete.” For those taking 11 or more virtual courses, 44% had a “Withdrawn” status and 23% were marked “Incomplete”. In each case, only 28% and 30% of the virtual enrollments, respectively, were actually classified as “Completed/Failed.” Please see the section on Pass Rate Calculations for more elaboration on the impact of such issues on pass rates.
By Virtual Usage
Generally speaking, virtual learners did better when they took fewer virtual courses. Students taking one to two virtual courses had a pass rate of 76% compared to a pass rate of 64% for those taking three to four virtual courses and a pass rate of 51% for students taking five or more virtual courses. About 44% of students fell under the description of taking one or two virtual courses; however, 42% were found to have taken five or more virtual courses during the year. See Table D13.
State Assessment
Fast Facts
44% of 11th grade virtual learners who took the SAT were proficient in the Reading/Writing component. A quarter tested proficient in Math.
Higher proficiency rates were seen with higher non-virtual performance and with students who were not in poverty.
A higher percentage of part-time virtual learners reached levels of proficiency on state assessment measures than their full-time counterparts.
By Subject Area
State assessment data can be used to provide an independent measure of student performance. Based on SAT and M-STEP data from students in 11th grade, virtual learners showed lower percentages reaching proficiency on the Evidence-Based Reading and Writing (SAT), Mathematics (SAT), and Social Studies (M-STEP) examinations than the statewide proficiency rates. Forty-four percent of the 11th grade virtual learners tested proficient in Evidence-Based Reading and Writing and about a quarter were proficient in Mathematics. For Social Studies, 37% of the virtual learners reach proficiency. See Table E1.
By Non-Virtual Performance
As would be expected, the percentage of virtual learners testing proficient on these state tests varied considerably when accounting for their non-virtual performance. For instance, students taking a minimum of three non-virtual courses and passing all of them had proficiency rates that exceeded the statewide average for each of tests. Students who did not pass one or two of their non-virtual courses and those not passing three or more of their non-virtual courses had much lower rates of proficiency. See Table E2.
By Poverty Status
Students in poverty consistently recorded proficiency rates that were about 30 percentage points lower than their peers who were not in poverty. As an example, 29% of virtual learners in poverty scored proficient on the Evidence-Based Reading and Writing exam compared to 60% for those who were not in poverty. See Table E3.
By Full- or Part-Time Type
Students taking virtual courses in a part-time capacity had higher rates of proficiency on the assessments compared to full-time virtual learners. The gap was sizable; ranging from a high of 19 percentage points on the mathematics assessment to a low of 14 on the social studies exam. See Table E4.
Maps
Alpena-Montmorency-Alcona, Berrien, COOR, Gogebic-Ontonagon, Jackson, St. Joseph, and Tuscola ISDs/RESAs had at least 15% of students in their service areas take a virtual course in 2018-19. In total, there were 22 ISDs/RESA with 10% or more of the students taking virtual courses. See Figure 2.
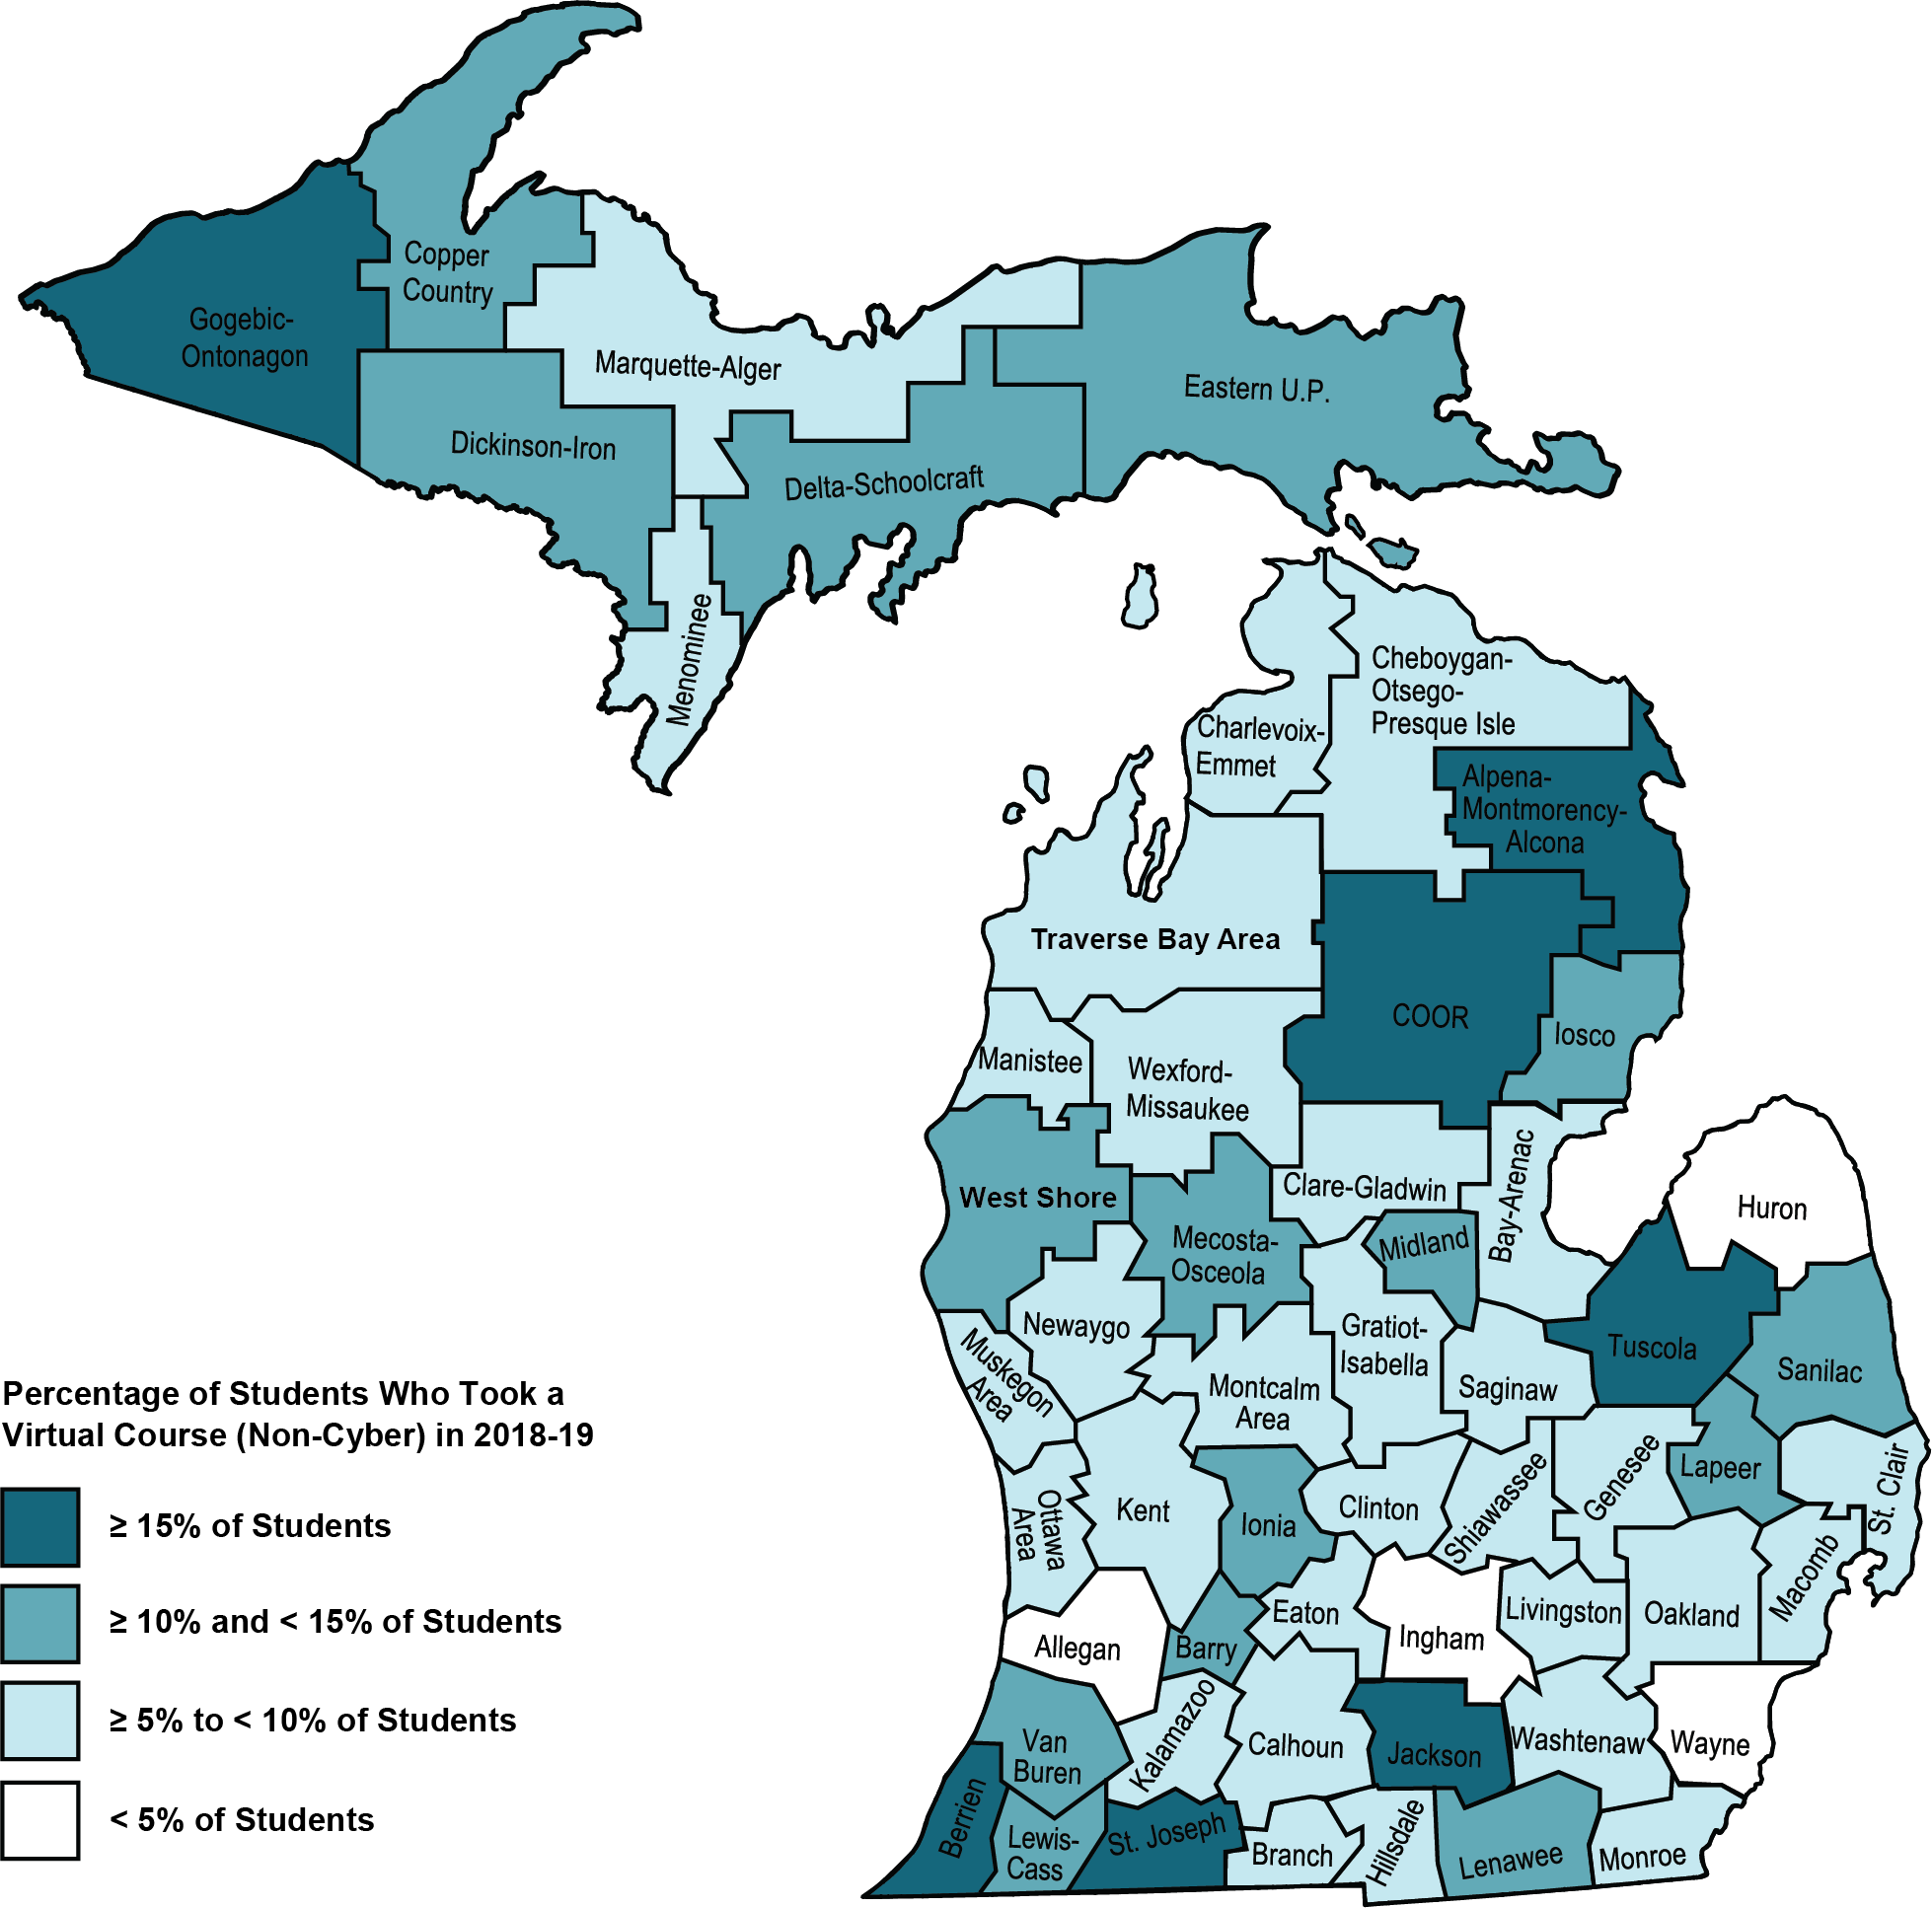
Figure 2. 2018-19 Percentage of Students Who Took a Virtual Course (Non-Cyber) by ISDOne in five students attending a PSA cyber school resided within the Wayne RESA service area. The Macomb and Oakland ISD service area were the only other ISDs with 1,000 or more students attending PSA cyber schools. Genesee, Kent, and Ingham ISDs each had between 500 and less than 1,000 students from their area attending PSA cyber schools. See Figure 3.
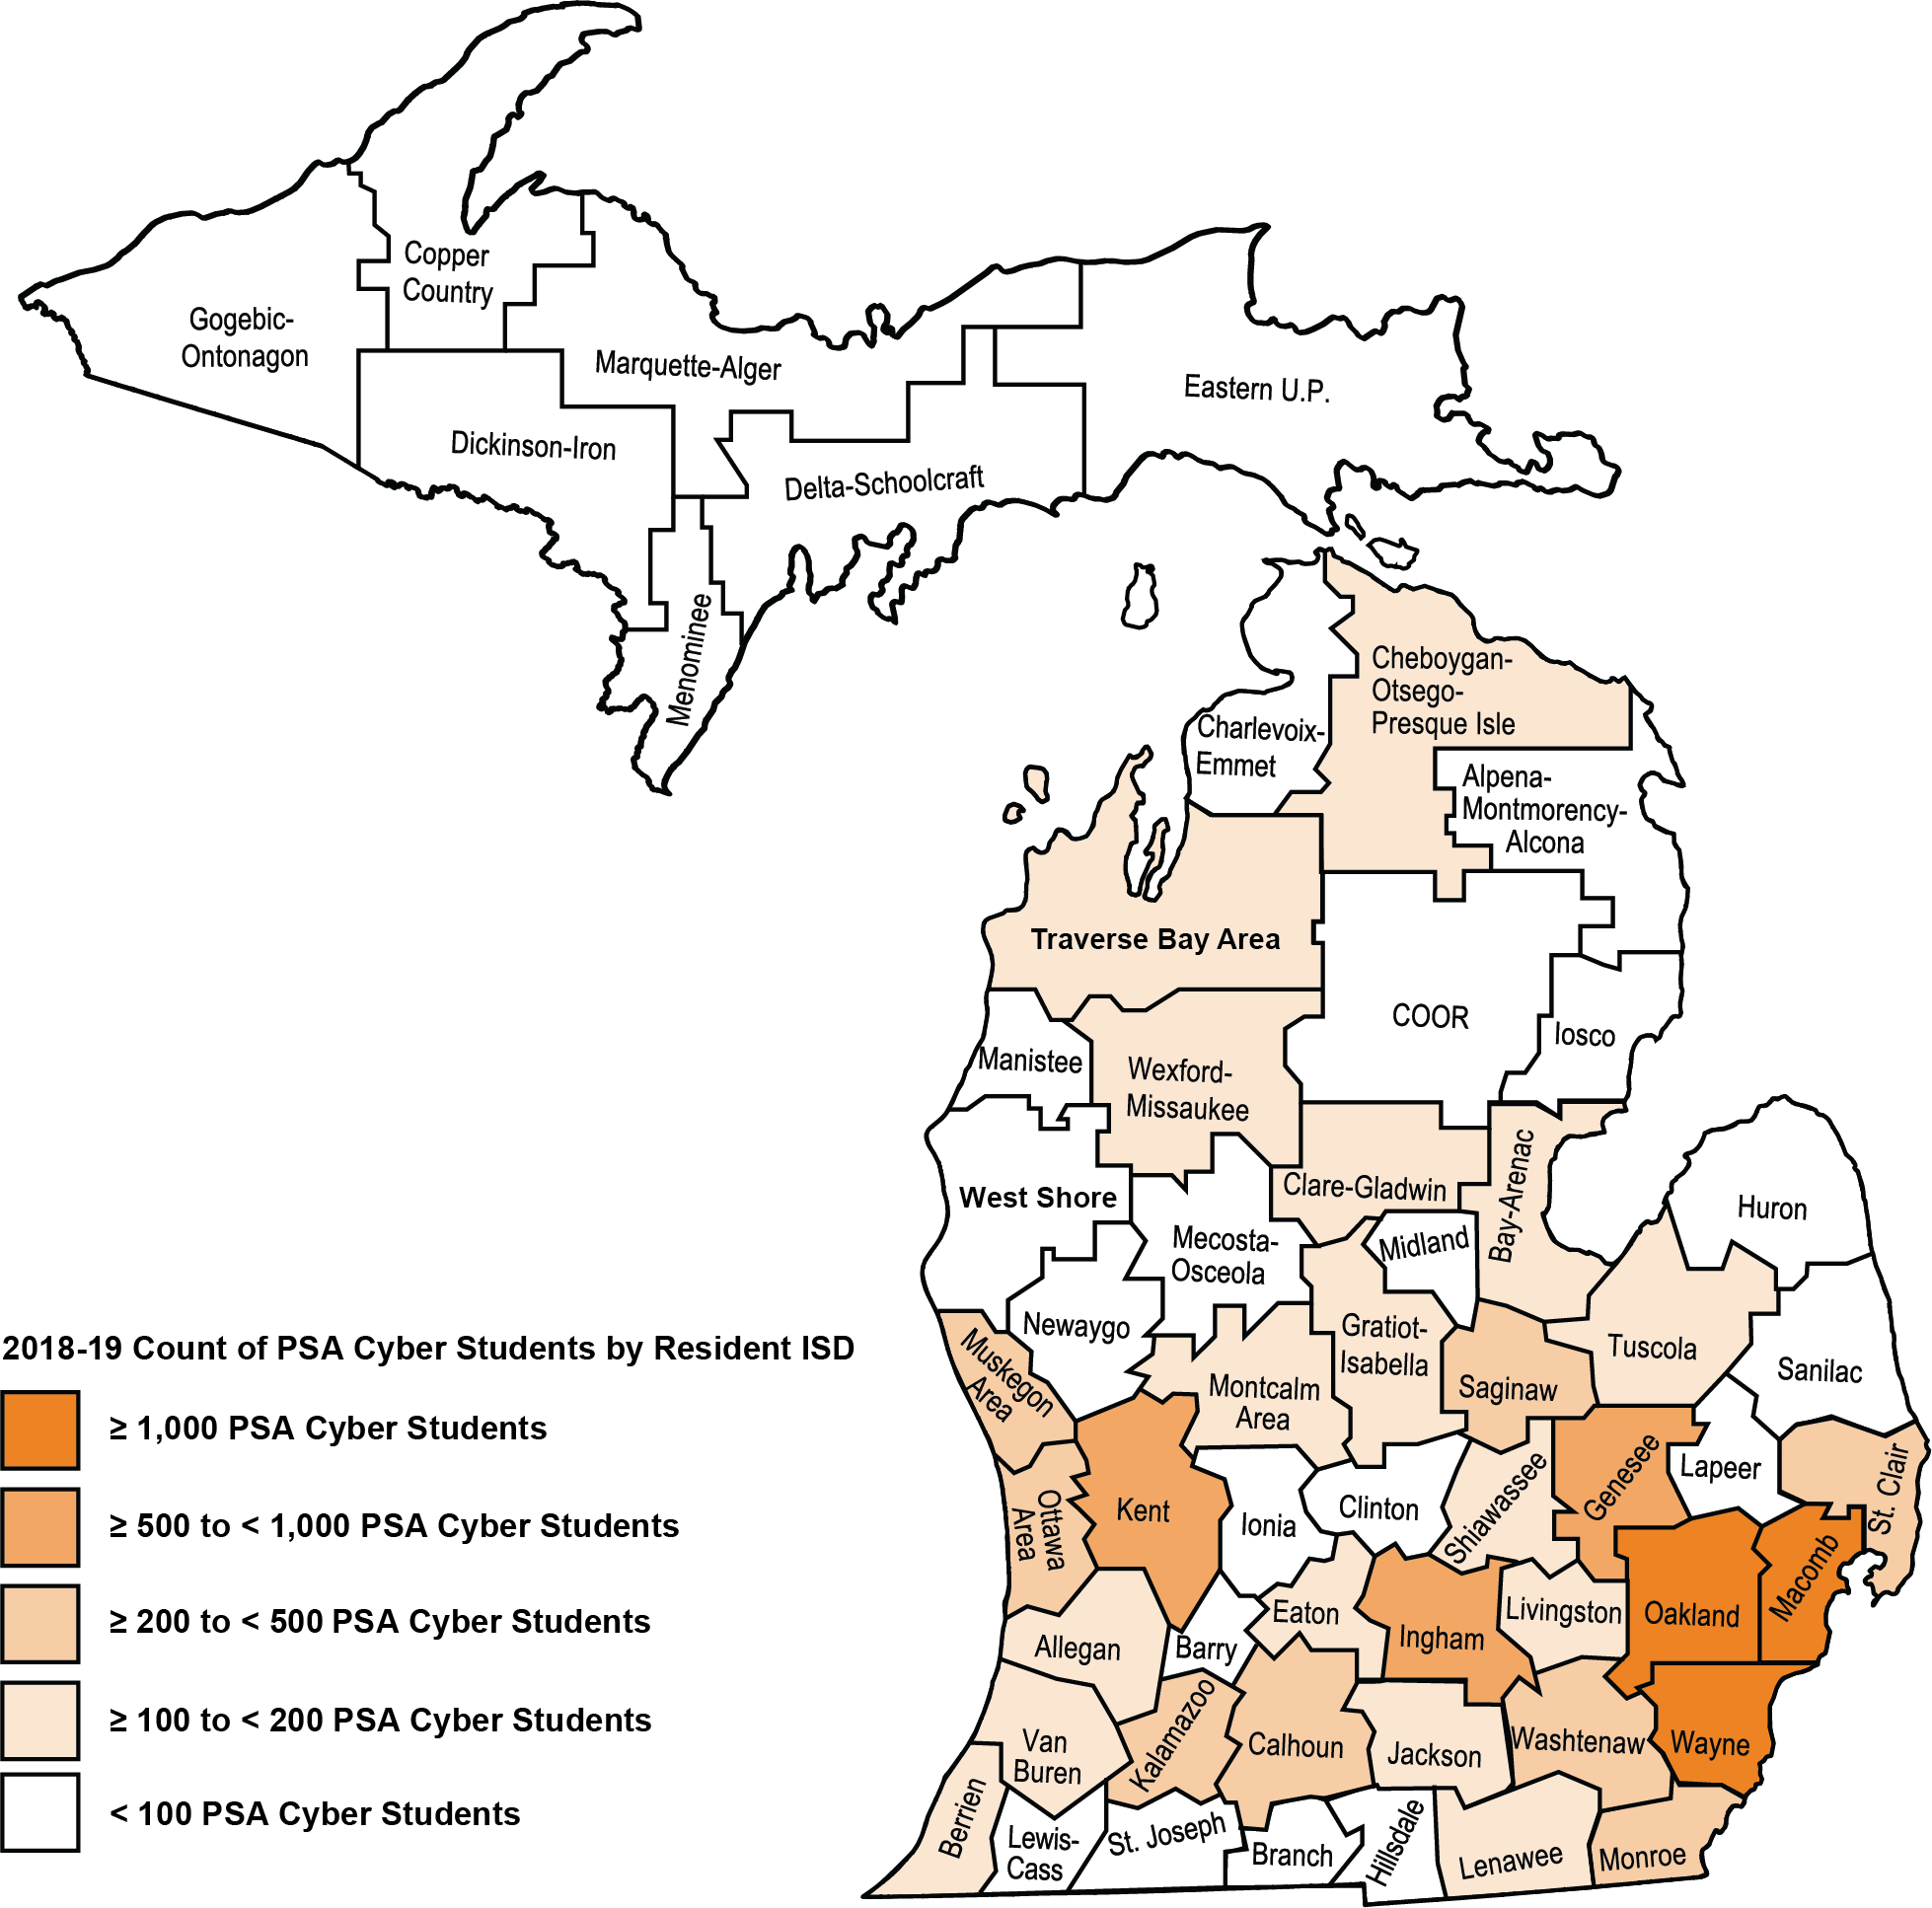
Figure 3. 2018-19 Count of PSA Cyber School Students by Resident ISD
Conclusion
This year’s report represents the ninth year of data on the effectiveness of virtual learning in Michigan’s K-12 system. Many trends witnessed in past years continue to exist. See Table 1. The use of virtual learning as evidenced by the number of virtual learners, virtual enrollments, and schools with virtual learners continues to grow. At the same time, performance in virtual courses has been stagnant over the past several years.Table 1.
School Year | # of Virtual Learners | # of Virtual Enrollments | # of Schools | Virtual Pass Rate |
|---|---|---|---|---|
2010-11 | 36,348 | 89,921 | 654 | 66% |
2011-12 | 52,219 | 153,583 | 850 | 62% |
2012-13 | 55,271 | 185,053 | 906 | 60% |
2013-14 | 76,122 | 319,630 | 1,007 | 57% |
2014-15 | 91,261 | 445,932 | 1,072 | 60% |
2015-16 | 90,878 | 453,570 | 1,026 | 58% |
2016-17 | 101,359 | 517,470 | 1,102 | 55% |
2017-18 | 112,688 | 581,911 | 1,158 | 55% |
2018-19 | 120,669 | 639,130 | 1,225 | 55% |
Summary of Virtual Learning Metrics by School Year Since 2010-11The overall pass rate remains a reason for pessimism. Successful implementations of virtual learning are outnumbered by poorly performing programs, and there are too many students having little to no success. Almost a quarter of students did not pass any of their virtual courses with over 12,550 students taking at least five virtual courses and passing none of them. These practices need to stop. They need to be replaced by the practices at the more than 500 Michigan schools with virtual pass rates of 80% or higher. In these higher performing schools, the data show:
Successful virtual programs can support various numbers of students, enrollments, and courses offerings – These schools showed success with less than 10 students (36%) and more than 50 students (41%). Some offered few enrollments (over 100 schools had less than 10 virtual enrollments) while others offered many (over 200 schools had 100 or more). They also varied in the numbers of course titles offered. About 40% offered 10 or fewer virtual courses titles. About a quarter had between 26 and 50 courses, and over 10% of the schools had students in more than 50 different virtual courses.
LEA and PSA schools can offer successful virtual programs – Over 40 percent of LEA schools with virtual programs had schoolwide virtual pass rates of 80% or higher. For PSA schools, it was about one out of every three. Both traditional school districts and charter districts can run successful virtual programs.
Schools in cities, suburbs, towns, and rural settings are proving virtual learning success – There were more than 75 city and 75 town schools with virtual pass rates of 80% or higher. There were just shy of 150 for suburban locales, and almost 190 of such schools in rural settings. These schools are proving virtual learning can succeed across the various geographies of the state.
These schools show strong results across students of different race/ethnicities – Whereas a sizable performance gap exists for students based on their race/ethnicity when looking at all virtual programs, those gaps close substantially for these 500+ schools. Consider that the pass rate for African-American or Black students is 90% in these schools (compared to 43% in the overall virtual population) and only lags the White virtual pass rate in these schools by 1% (compared to 16% in the overall virtual population). For each of the known race/ethnicities, the virtual pass rate ranges between 88% to 93% for these schools.
Students in poverty are succeeding in these virtual programs – Recall that across the entire state, students in poverty had a pass rate (48%) that was 21 percentage points lower than those virtual students who were not in poverty. For these 500+ schools, the virtual pass rate for students in poverty rose to 88% - much closer to the 92% virtual pass rate for the students who were not in poverty. Students in poverty continued to represent a large percentage of virtual learners (40%) in these schools, but quite a bit smaller than the 57% seen in all virtual programs across the state.
Both full- and part-time programs can run effective virtual programs – These 500+ schools show that over 40% of part-time programs were able to yield schoolwide virtual pass rates of 80% or higher. It appears a bit more difficult for full-time programs, but 12 of the 79 full-time programs also achieved this success benchmark.
Both general education and alternative education programs reached 80% school-wide virtual pass rates - There were over 450 general education schools in Michigan that achieved schoolwide virtual pass rates of 80% or higher. This was one out of every two general education schools with virtual programs. For alternative programs, 42 schools reached this mark. As a percentage of alternative programs, it represented just 14% of such schools, indicating that while possible, this threshold of success remains a sizable challenge.
Virtual students can perform at or above their face-to-face performance level – In these 500+ schools, there were over 6,000 virtual learners who took a minimum of three virtual courses and had data for a minimum of three non-virtual courses. Eighty-one percent of these students had virtual pass rates that met or exceeded their non-virtual pass rates.
Appendix A - Methodology
About the Data
The data for this report came from the following sources:
Michigan Student Data System – School Year 2018-2019;
Educational Entity Master (EEM);
Michigan Student Data System Teacher Student Data Link (TSDL) – Collection Year 2018-2019; and
Michigan’s K-12 Virtual Learning Effectiveness Report, 2017-18 – Used for comparing this year’s data with the 2017-18 school year.
Because the data for this report incorporates this variety of sources, the findings within may differ from those found through the MI School Data portal which may use different query parameters.The majority of enrollments classified as virtual in this report were treated as such due to the TSDL virtual method field indicating virtual delivery. However, this field is known to contain inaccuracies. For the purposes of this report, additional methods were used to identify enrollments with a high likelihood of having been delivered virtually. Each of the methods used, along with the percentage of enrollments it contributed to the total, are outlined below.
TSDL Virtual Method Flag = Yes. Enrollments where the TSDL virtual method field was set to “Blended Learning,” “Digital Learning,” or “Online Course” were treated as virtual. According to the TSDL Data Collection Manual, the virtual method field “indicates the type of virtual instruction the student is receiving. This could be virtual learning, online learning or computer courses; distance learning; or self-scheduled virtual learning” (see page 402 of the Michigan Student Data System Collection Details Manual Version 1.0). This strategy yielded 99% (631,667) of the virtual enrollments.
TSDL Local Course Title Field References Michigan Virtual. The strategy of searching the local course title field for common references to Michigan Virtual yielded less than 1% (864) of the virtual enrollments. The wild card search criteria for Michigan Virtual consisted of the following: ‘%MI Virtual%’, ‘%Mich Virt%’, ‘%MIVHS%’, ‘%MIVS%’, ‘%MVS%’, ‘%MVU%’, ‘%VH’, ‘%MVHS%’, ‘%MIVU%’, ‘%VHS%’, ‘MV%’, ‘%MV’, ‘%Michigan Virtual%’, ‘%IS: MV%’, ‘%IS:MV%’, ‘%MI Virt%’, ‘%MV HS%’, ‘Virtual HS%’, and ‘Mich. Virtual High School%’.
Local Course Title Field References Common Third Party Providers. Searching the local course title field for common references to known third-party providers of virtual courses yielded less than 1% (2,333) of the virtual enrollments. The wild card search criteria for common third-party providers consisted of the following: ‘%Apex%’, ‘APX%’, ‘%Aventa%’, ‘%BYU%’, ‘%Brigham%’, ‘%Compass%’, ‘%Edgen%’, ‘%2020%’, ‘%20/20%’, ‘%20-20%’, ‘%E20%’, ‘%Edison%’, ‘%FLVS%’, ‘%FVS%’, ‘%GenNet%’, ‘%Gen Net%’, ‘%K12 Virtual%’, ‘%K12:%’, ‘%K12vs%’, ‘%Lincoln Int%’, ‘%Little Lincoln%’, ‘%- Lincoln%’, ‘%(Lincoln)%’, ‘%Lincoln’, ‘%UNL%’, ‘%Middlebury%’, ‘%Nova net%’, ‘%Novanet%’, ‘%Odyssey%’,‘%Odware%’, ‘ODY%’, ‘%(OD%’, ‘%Edmentum%’, and ‘%Plato%’.
TSDL Local Course Title Field References Common Generic Labels for Online or Virtual Learning. Searching the local course title field for common references to online, distance, or virtual learning yielded less than 1% (4,266) of the virtual enrollments. The wild card search criteria for common generic labels for online or virtual learning consisted of the following: ‘%Online%’, ‘%On-line%’, ‘%On line%’, ‘%onl’, ‘%onli’, ‘%onlin’, ‘%- OL’, ‘%-OL’, ‘%O/L%’, ‘OL %’, ‘%STW%’, ‘%E-Learn%’, ‘%E-LRN%’, ‘%Virtual%’, ‘%- virt%’, and ‘%- DL’.
Michigan Virtual Students
In past years of this report, data on Michigan Virtual students were presented with two known issues. First, because Michigan Virtual is not a school entity and its data are not part of the state data sets, Michigan Virtual and CEPI used a matching process to attempt to tie the records together. This was always an imperfect matching process where some students taking Michigan Virtual courses were not able to be linked in the data set and, therefore, under-reported on students taking courses with Michigan Virtual. The second issue was that even when the process yielded a match for a student, it could not be determined which virtual courses the student took with Michigan Virtual as opposed to another course provider. Faced with that dilemma, the approach taken was to count all virtually delivered enrollments for such students as being provided by Michigan Virtual, recognizing that not all were actually delivered by Michigan Virtual.In preparing this year’s report, it was determined that the impact these two issues had on the data were significant enough to render the reporting value moot. However, Michigan Virtual’s Annual Report for 2018-19 does contain information on its student enrollments. For instance, data are provided on the number of students served (over 16,900), districts served (over 60% of LEA Districts), enrollments served (over 30,100) and its pass rate (82%). For more information about Michigan Virtual enrollments for the same school year as this report, please see that annual report.
Pass Rate Calculations
For this report, the pass rate was calculated based on the values recorded in the “Completion Status” field. For more information about the Completion Status field, including definitions for each status, see page 396 of the Michigan Student Data System Collection Details Manual Version 1.0. Column one of Table A1 displays the various statuses reported by schools for the virtual enrollments.Table A1.
Completion Status | # of Enrolls | % of Enrolls |
|---|---|---|
Audited (No Credit Issued) | 10,957 | 2% |
Completed / Failed | 99,927 | 16% |
Completed / Passed | 350,594 | 55% |
Incomplete | 65,162 | 10% |
Ongoing Enrolled | 42 | 0% |
Testing Out | 112 | 0% |
Withdrawn / Exited | 64,013 | 10% |
Withdrawn / Failing | 16,334 | 3% |
Withdrawn / Passing | 31,989 | 5% |
Total | 639,130 | 100% |
2018-19 Number and Percentage of Virtual Enrollments by Completion StatusThroughout this report, the pass rate calculated simply represents the percentage of virtual enrollments with a status of “Completed/Passed.” Notice that the percentage of enrollments with a “Completed/Passed” status in Table A1 matches the statewide pass rate. This pass rate formula remains consistent with past reports. Please keep in mind that calculating the pass rate in this manner will result in the lowest possible percentage.To illustrate why this is, consider the completion status of “Audited (No Credit Issued).” These virtual enrollments are not “failures” per se; however, including these enrollments in the total counts adds to the formula’s denominator without impacting to the numerator, the effect of which is to lower the percentage of other completion statuses including “Completed/Passed.” Another example is enrollments with a completion status of “Incomplete.” About 10% of the virtual enrollments in this report were classified as “Incomplete.” As such, they are treated in the report’s pass rate formula as zero passes, even though some may eventually be awarded a passing status. Finally, it is unclear how to best treat enrollments with a “Withdrawn” status. For instance, 5% of the virtual enrollments in 2018-19 were marked as “Withdrawn/Passing,” meaning that the student was passing the course at the time the student was withdrawn. Should these enrollments be counted as failures? What about students whose enrollments were marked as “Withdrawn/Exited” (10% of the virtual enrollments)? There is no way to determine whether that exiting occurred in the first few weeks of class or the final weeks of class. The data do not provide insight into whether the student was reenrolled in a different course or whether it was too late for reenrollment in a credit-bearing opportunity for the student.The research team raises these issues because they represent questions for which there are no definitive answers. In the end, the team decided to report the pass rate as the percentage of all virtual enrollments that were reported as “Completed/Passed.” To provide readers with a better idea of the impact of this approach, additional data tables are provided in Appendix F to allow interested readers in drawing their own conclusions and calculating their own formulas for many of the pass rates reported.
Data Limitations
Because of the methodology described above, some enrollments are counted as virtual in this report that should not be – either because they were mistakenly marked as virtual by the school and/or because the local course title searches implemented by the research team yielded false positives. On the other hand, it is also safe to assume that some enrollments that should have been marked as virtual were not, both because they were not correctly flagged by the school and because the local course title did not give an indication of its virtual nature that aligned with the conventions used in the strategies outlined above. Consequently, the figures in this report should be treated as estimates that, generally speaking, convey the trends observed for the school year.One final caveat for interpreting the results published in this report: There is clear variability in what schools report to the state as a “course.” Some records align well with reporting conventions outlined by the U.S. Department of Education under their School Codes for the Exchange of Data (SCED) (see the U.S. Department of Education’s School Codes for the Exchange of Data). However, a review of the data suggests that many schools submit course records that may be better described as course units or lessons. Hence, while one district may report a single course for a child, for instance, Algebra I, another school might submit five such records, all with the same subject areas and course identifier codes, but with different local course IDs. Table A2 provides a glimpse into such reporting variability. Consider the part-time schools. For that group, 48% of the students had 11 to 15 courses reported (including both virtual and non-virtual enrollments), but 21% of part-time students had more than that. This issue is pointed out to alert readers that not all courses likely represent a semester- or trimester-length unit.Table A2.
Total Course Count by Student | Full-Time | Part-Time |
|---|---|---|
1 to 5 | 12% | 10% |
6 to 10 | 29% | 22% |
11 to 15 | 43% | 48% |
16 to 20 | 11% | 15% |
21+ | 5% | 6% |
Total | 100% | 100% |
2018-19 Percentage of Students by Total Student Course Counts (Virtual and Non-Virtual) and Full- or Part-Time Schools
Appendix - B School Tables
Note: Clicking on the orange hyperlinked table number will return to the section of the report that discusses the table.Table B1.
Grade Level | # of Enrolls | % of Enrolls | % Change | Pass Rate | % Change from 17-18 |
|---|---|---|---|---|---|
K | 8,356 | 1% | 11% | 74% | +4% |
1 | 10,029 | 2% | 23% | 69% | +2% |
2 | 10,118 | 2% | -4% | 69% | +8% |
3 | 9,578 | 1% | -4% | 71% | +0% |
4 | 11,229 | 2% | -3% | 71% | +2% |
5 | 13,656 | 2% | 16% | 67% | -2% |
6 | 17,924 | 3% | 6% | 66% | +1% |
7 | 22,931 | 4% | 0% | 63% | +0% |
8 | 30,283 | 5% | 5% | 60% | +1% |
9 | 97,326 | 15% | 8% | 41% | +0% |
10 | 112,447 | 18% | 10% | 48% | +2% |
11 | 117,195 | 18% | 13% | 53% | -2% |
12 | 178,058 | 28% | 13% | 59% | -3% |
Total | 639,130 | 100% | 10% | 55% | 0% |
2018-19 Count and Pass Rate of K-12 Virtual Enrollments by Grade LevelTable B2.
Grade Level | Virtual Pass Rate | Non-Virtual Pass Rate |
|---|---|---|
K | 74% | 51% |
1 | 69% | 65% |
2 | 69% | 67% |
3 | 71% | 55% |
4 | 71% | 59% |
5 | 67% | 72% |
6 | 66% | 81% |
7 | 63% | 68% |
8 | 60% | 69% |
9 | 41% | 66% |
10 | 48% | 73% |
11 | 53% | 79% |
12 | 59% | 81% |
Total | 55% | 76% |
2018-19 Pass Rate Comparison for Virtual Learners in Their Virtual and Non-Virtual CoursesTable B3.
School Pass Rate | # of Schools | % of Schools |
|---|---|---|
0% to <10% | 80 | 7% |
10% to <20% | 34 | 3% |
20% to <30% | 55 | 4% |
30% to <40% | 77 | 6% |
40% to <50% | 72 | 6% |
50% to <60% | 121 | 10% |
60% to <70% | 135 | 11% |
70% to <80% | 147 | 12% |
80% to <90% | 188 | 15% |
90% to 100% | 316 | 26% |
Total | 1,225 | 100% |
2018-19 Number and Percentage of Schools by School Pass RateTable B4.
Entity Type | # of Schools | % of Schools | # of Enrolls | % of Enrolls |
|---|---|---|---|---|
ISD School | 28 | 2% | 8,420 | 1% |
LEA School | 1,072 | 88% | 368,579 | 58% |
LEA Unique Education Provider | 15 | 1% | 11,638 | 2% |
PSA School | 110 | 9% | 250,493 | 39% |
Total | 1,225 | 100% | 639,130 | 100% |
2018-19 Number and Percentage of Schools and Virtual Enrollments by Entity TypeTable B5.
Entity Type | Pass Count | # of Enrolls | Pass Rate |
|---|---|---|---|
ISD School | 5,013 | 8,420 | 60% |
LEA School | 214,941 | 368,579 | 58% |
LEA Unique Education Provider | 8,060 | 11,638 | 69% |
PSA School | 122,580 | 250,493 | 49% |
Total | 350,594 | 639,130 | 55% |
2018-19 Virtual Pass Rate by Entity TypeTable B6.
Entity Type | # of FT Schools | % of FT Schools |
|---|---|---|
ISD School | 1 | 1% |
LEA School | 59 | 75% |
LEA Unique Education Provider | 3 | 4% |
PSA School | 16 | 20% |
Total | 79 | 100% |
2018-19 Number and Percentage of Full-Time (FT) Virtual or Cyber SchoolTable B7.
Entity Type | # of FT Students | % of FT Students | # of FT Enrolls | % of FT Enrolls | Pass Rate |
|---|---|---|---|---|---|
ISD School | NR | NR | NR | NR | NR |
LEA School | 11,740 | 38% | 92,885 | 31% | 51% |
LEA Unique Education Provider | NR | NR | NR | NR | NR |
PSA School | 18,916 | 61% | 199,694 | 68% | 49% |
Total | 31,176 | 100% | 295,234 | 100% | 49% |
2018-19 Number and Percentage of Students and Enrollments from Full-Time (FT) Virtual or Cyber Schools with Pass RatesNote: Data are not reported (NR) if there were less than 10 schools for that cell or to prevent calculating cell value.Table B8.
Entity Type | # of PT Schools | % of PT Schools |
|---|---|---|
ISD School | 27 | 2% |
LEA School | 1,013 | 88% |
LEA Unique Education Provider | 12 | 1% |
PSA School | 94 | 8% |
Total | 1,146 | 100% |
2018-19 Number and Percentage of Part-Time (PT) Virtual SchoolsTable B9.
Entity Type | # of PT Students | % of PT Students | # of PT Enrolls | % of PT Enrolls | Pass Rate |
|---|---|---|---|---|---|
ISD School | 1,502 | 2% | 7,698 | 2% | 58% |
LEA School | 78,753 | 86% | 275,694 | 80% | 61% |
LEA Unique Education Provider | 2,164 | 2% | 9,705 | 3% | 80% |
PSA School | 9,433 | 10% | 50,799 | 15% | 50% |
Total | 91,181 | 100% | 343,896 | 100% | 60% |
2018-19 Number and Percentage of Students and Enrollments from Part-Time (PT) Virtual Schools with Pass RatesTable B10.
School Emphasis | # of Schools | % of Schools | # of Enrolls | % of Enrolls |
|---|---|---|---|---|
Alternative Education | 290 | 24% | 277,894 | 43% |
General Education | 916 | 75% | 357,347 | 56% |
Reportable Program | NR | NR | NR | NR |
Special Education | 17 | 1% | 3,829 | 1% |
Vocational/CTE | NR | NR | NR | NR |
Total | 1,225 | 100% | 639,130 | 100% |
2018-19 Number and Percentage of Schools and Virtual Enrollments by School EmphasisNote: Data are not reported (NR) if there were less than 10 schools for that cell or to prevent calculating cell value.Table B11.
School Emphasis | Pass Count | # of Enrolls | Pass Rate |
|---|---|---|---|
Alternative Education | 115,960 | 277,894 | 42% |
General Education | 232,583 | 357,347 | 65% |
Reportable Program | NR | NR | NR |
Special Education | 1,992 | 3,829 | 52% |
Vocational/CTE | NR | NR | NR |
Total | 350,594 | 639,130 | 55% |
2018-19 Virtual Pass Rate by School EmphasisNote: Data are not reported (NR) if there were less than 10 schools for that cell or to prevent calculating cell value.Table B12.
Entity Type | General Ed Pass Rate | Alternative Ed Pass Rate |
|---|---|---|
ISD School | NR | NR |
LEA School | 74% | 44% |
LEA Unique Education Provider | NR | 65% |
PSA School | 57% | 30% |
Total | 65% | 42% |
2018-19 Virtual Pass Rates for General Education and Alternative Education Schools by Entity TypeNote: Data are not reported (NR) if there were less than 10 schools for that cell.Table B13.
# of Virtual Enrolls Per School | # of Schools | % of Schools | # of Enrolls | % of Enrolls |
|---|---|---|---|---|
1 to 9 | 221 | 18% | 897 | 0% |
10 to 19 | 84 | 7% | 1,187 | 0% |
20 to 29 | 49 | 4% | 1,195 | 0% |
30 to 39 | 36 | 3% | 1,250 | 0% |
40 to 49 | 34 | 3% | 1,510 | 0% |
50 to 59 | 22 | 2% | 1,198 | 0% |
60 to 69 | 22 | 2% | 1,417 | 0% |
70 to 79 | 23 | 2% | 1,702 | 0% |
80 to 89 | 29 | 2% | 2,474 | 0% |
9o to 99 | 26 | 2% | 2,454 | 0% |
100+ | 679 | 55% | 623,846 | 98% |
Total | 1,225 | 100% | 639,130 | 100% |
2018-19 Number and Percentage of Schools and Virtual Enrollments by Number of Virtual Enrollments per SchoolTable B14.
School Pass Rate | 1 to 2 Virtual Courses / Learner | 3 to 4 Virtual Courses / Learner | 4+ Virtual Courses / Learner |
|---|---|---|---|
0% to <10% | 8% | 5% | 6% |
10% to <20% | 1% | 3% | 6% |
20% to <30% | 2% | 3% | 9% |
30% to <40% | 1% | 4% | 16% |
40% to <50% | 4% | 4% | 10% |
50% to <60% | 7% | 10% | 13% |
60% to <70% | 9% | 13% | 12% |
70% to <80% | 13% | 16% | 5% |
80% to <90% | 19% | 18% | 7% |
90% to 100% | 36% | 23% | 15% |
Total | 100% | 100% | 100% |
2018-19 Percentage of Schools by Ratio of Virtual Courses to Student and School Pass RateTable B15.
Locale | # of Schools | % of Schools | # of Enrolls | % of Enrolls |
|---|---|---|---|---|
City | 188 | 15% | 127,395 | 20% |
Not Specified | 37 | 3% | 50,187 | 8% |
Rural | 422 | 34% | 159,755 | 25% |
Suburban | 381 | 31% | 195,895 | 31% |
Town | 197 | 16% | 105,898 | 17% |
Total | 1,225 | 100% | 639,130 | 100% |
2018-19 Number and Percentage of Schools and Virtual Enrollments by LocaleTable B16.
Locale | 1 to 24 Enrolls | 25 to 49 Enrolls | 50 to 74 Enrolls | 75 to 99 Enrolls | 100+ Enrolls | Total |
|---|---|---|---|---|---|---|
City | 32% | 9% | 5% | 2% | 52% | 100% |
Not Specified | 22% | 5% | 0% | 3% | 70% | 100% |
Rural | 23% | 10% | 6% | 8% | 54% | 100% |
Sub | 30% | 6% | 4% | 4% | 56% | 100% |
Town | 26% | 6% | 4% | 7% | 58% | 100% |
2018-19 Percentage of Schools with Virtual Enrollments by Virtual Enrollment Totals and LocaleTable B17.
Locale | Pass Rate | % Change from 17-18 |
|---|---|---|
City | 51% | 0% |
Not Specified | 50% | +11% |
Rural | 51% | -9% |
Sub | 60% | +0% |
Town | 58% | -1% |
Total | 55% | 0% |
2018-19 Virtual Pass Rate by LocaleTable B18.
Locale | 0% to 20% Pass Rate | 20% to 40% Pass Rate | 40% to 60% Pass Rate | 60% to 80% Pass Rate | 80% to 100% Pass Rate | Total |
|---|---|---|---|---|---|---|
City | 16% | 13% | 15% | 15% | 40% | 100% |
Not Specified | 27% | 19% | 11% | 8% | 35% | 100% |
Rural | 7% | 9% | 14% | 27% | 43% | 100% |
Sub | 9% | 10% | 18% | 25% | 39% | 100% |
Town | 7% | 13% | 19% | 23% | 39% | 100% |
2018-19 Percentage of Schools with Virtual Enrollments by Building Pass Rate and Locale
Appendix - C Course Tables
Note: Clicking on the orange hyperlinked table number will return to the section of the report that discusses the table.Table C1.
Subject Area | # of Enrolls | % of Enrolls | Pass Rate |
|---|---|---|---|
Agriculture, Food, and Natural Resources | 960 | 0% | 76% |
Architecture and Construction | 260 | 0% | 79% |
Business and Marketing | 8,572 | 1% | 69% |
Communication and Audio / Visual Technology | 3,285 | 1% | 66% |
Computer and Information Sciences | 11,110 | 2% | 59% |
Engineering and Technology | 4,203 | 1% | 62% |
English Language and Literature | 119,337 | 19% | 51% |
Fine and Performing Arts | 39,973 | 6% | 60% |
Foreign Language and Literature | 37,669 | 6% | 54% |
Health Care Sciences | 4,070 | 1% | 61% |
Hospitality and Tourism | 935 | 0% | 59% |
Human Services | 1,497 | 0% | 80% |
Life and Physical Sciences | 86,673 | 14% | 51% |
Manufacturing | 74 | 0% | 78% |
Mathematics | 110,384 | 17% | 49% |
Military Science | 134 | 0% | 75% |
Miscellaneous | 52,657 | 8% | 65% |
Nonsubject Specific | 713 | 0% | 73% |
Physical, Health, and Safety Education | 48,431 | 8% | 61% |
Public, Protective, and Government Services | 2,074 | 0% | 68% |
Religious Education and Theology | 150 | 0% | 87% |
Social Sciences and History | 105,844 | 17% | 55% |
Transportation, Distribution, and Logistics | 125 | 0% | 84% |
Total | 639,130 | 100% | 55% |
2018-19 Number and Percentage of Virtual Enrollments with Pass Rate by Subject AreaTable C2.
Subject Area | Virtual Pass Rate | Non-Virtual Pass Rate |
|---|---|---|
Agriculture, Food, and Natural Resources | 76% | 82% |
Architecture and Construction | 79% | 84% |
Business and Marketing | 69% | 84% |
Communication and Audio / Visual Technology | 66% | 87% |
Computer and Information Sciences | 59% | 79% |
Engineering and Technology | 62% | 83% |
English Language and Literature | 51% | 76% |
Fine and Performing Arts | 60% | 84% |
Foreign Language and Literature | 54% | 74% |
Health Care Sciences | 61% | 87% |
Hospitality and Tourism | 59% | 81% |
Human Services | 80% | 87% |
Life and Physical Sciences | 51% | 75% |
Manufacturing | 78% | 81% |
Mathematics | 49% | 72% |
Military Science | 75% | 81% |
Miscellaneous | 65% | 74% |
Nonsubject Specific | 73% | 64% |
Physical, Health, and Safety Education | 61% | 79% |
Public, Protective, and Government Services | 68% | 86% |
Religious Education and Theology | 87% | 90% |
Social Sciences and History | 55% | 75% |
Transportation, Distribution, and Logistics | 84% | 81% |
Total | 55% | 76% |
2018-19 Pass Rate Comparison for Virtual Learners for Their Virtual and Non-Virtual Courses by Subject AreaTable C3.
English Language and Literature Course Titles | # of Enrolls | % of Enrolls | Pass Rate |
|---|---|---|---|
English / Language Arts I (9th grade) | 22,570 | 19% | 39% |
English / Language Arts II (10th grade) | 20,599 | 17% | 42% |
English/Language Arts III (11th grade) | 17,944 | 15% | 51% |
English/Language Arts IV (12th grade) | 17,652 | 15% | 55% |
Language Arts (grade 8) | 3,977 | 3% | 55% |
Language Arts (grade 5) | 3,060 | 3% | 56% |
Language Arts (grade 7) | 2,979 | 2% | 56% |
English Language and Literature - Other | 2,488 | 2% | 55% |
Language Arts (grade 4) | 2,335 | 2% | 58% |
American Literature | 2,291 | 2% | 56% |
Total | 95,895 | 80% | 48% |
2018-19 Number and Percentage of Virtual Enrollments with Pass Rate by Course Title for the Top 10 Most Enrolled in English Language and Literature CoursesNote: % of Enrolls based on the overall total of 119,337 for this subject area.Table C4.
Mathematics Course Titles | # of Enrolls | % of Enrolls | Pass Rate |
|---|---|---|---|
Geometry | 21,817 | 20% | 44% |
Algebra II | 19,009 | 17% | 49% |
Algebra I | 18,071 | 16% | 35% |
Consumer Math | 7,533 | 7% | 64% |
Algebra I-Part 1 | 4,990 | 5% | 38% |
Pre-Algebra | 4,611 | 4% | 42% |
Mathematics - Other | 3,965 | 4% | 47% |
Mathematics (grade 7) | 3,336 | 3% | 59% |
Mathematics (grade 8) | 2,996 | 3% | 53% |
Algebra I—Part 2 | 2,926 | 3% | 46% |
Total | 89,254 | 81% | 46% |
2018-19 Number and Percentage of Virtual Enrollments with Pass Rate by Course Title for the Top 10 Most Enrolled in Mathematics CoursesNote: % of Enrolls based on the overall total of 110,384 for this subject area.Table C5.
Life and Physical Sciences Course Titles | # of Enrolls | % of Enrolls | Pass Rate |
|---|---|---|---|
Biology | 21,426 | 25% | 42% |
Chemistry | 15,062 | 17% | 48% |
Earth Science | 9,918 | 11% | 43% |
Physical Science | 6,676 | 8% | 48% |
Physics | 3,309 | 4% | 58% |
Earth/Space Science | 3,234 | 4% | 57% |
Environmental Science | 3,202 | 4% | 59% |
Life and Physical Sciences - Other | 2,358 | 3% | 56% |
Earth and Space Science | 1,946 | 2% | 50% |
Science (grade 8) | 1,878 | 2% | 62% |
Total | 69,009 | 80% | 48% |
2018-19 Number and Percentage of Virtual Enrollments with Pass Rate by Course Title for the Top 10 Most Enrolled in Life and Physical Sciences CoursesNote: % of Enrolls based on the overall total of 86,673 for this subject area.Table C6.
Social Sciences and History Course Titles | # of Enrolls | % of Enrolls | Pass Rate |
|---|---|---|---|
U.S. History - Comprehensive | 16,718 | 16% | 50% |
Economics | 12,200 | 12% | 56% |
World History and Geography | 11,855 | 11% | 41% |
World History—Overview | 11,671 | 11% | 53% |
U.S. Government - Comprehensive | 7,185 | 7% | 56% |
Psychology | 5,010 | 5% | 65% |
Civics | 4,885 | 5% | 47% |
Modern U.S. History | 3,574 | 3% | 50% |
Sociology | 3,002 | 3% | 62% |
U.S. History—Other | 2,701 | 3% | 42% |
Total | 78,801 | 74% | 52% |
2018-19 Number and Percentage of Virtual Enrollments with Pass Rate by Course Title for the Top 10 Most Enrolled in Social Sciences and History CoursesNote: % of Enrolls based on the overall total of 105,844 for this subject area.Table C7.
AP Course Title | # of Enrolls | % of Enrolls | Pass Rate |
|---|---|---|---|
AP Art-History of Art | 54 | 1% | 72% |
AP Biology | 167 | 4% | 80% |
AP Calculus AB | 137 | 4% | 85% |
AP Calculus BC | 92 | 2% | 88% |
AP Chemistry | 137 | 4% | 92% |
AP Comparative Government and Politics | 5 | 0% | NR |
AP Computer Science A | 221 | 6% | 91% |
AP Computer Science AB | 32 | 1% | 84% |
AP Economics | 9 | 0% | NR |
AP English Language and Composition | 219 | 6% | 88% |
AP English Literature and Composition | 251 | 7% | 84% |
AP Environmental Science | 106 | 3% | 83% |
AP European History | 6 | 0% | NR |
AP French Language and Culture | 23 | 1% | NR |
AP Government | 47 | 1% | 62% |
AP Human Geography | 52 | 1% | 100% |
AP Macroeconomics | 213 | 6% | 87% |
AP Microeconomics | 189 | 5% | 88% |
AP Music Theory | 80 | 2% | 40% |
AP Physics B | 77 | 2% | 40% |
AP Physics C | 46 | 1% | 100% |
AP Psychology | 809 | 22% | 84% |
AP Spanish Language and Culture | 97 | 3% | 74% |
AP Statistics | 243 | 6% | 89% |
AP Studio Art-Drawing Portfolio | 1 | 0% | NR |
AP Studio Art-General Portfolio | 3 | 0% | NR |
AP U.S. Government and Politics | 77 | 2% | 82% |
AP U.S. History | 197 | 5% | 81% |
AP World History | 152 | 4% | 79% |
Total | 3,742 | 100% | 84% |
2018-19 Number and Percentage of Virtual Enrollments with Pass Rate for AP CoursesNote: An additional 519 enrollments had a course type listed as Advanced Placement, but did not match an AP SCED Code. Similarly, there existed local course titles with AP in the title that did not have an AP SCED Code. Thus, it is very likely the data above underreports the number of students taking AP courses virtually. Pass Rates are not reported (NR) if there were less than 25 for that cell. Table C8.
Subject Area | % City | % Not Specified | % Rural | % Suburb | % Town |
|---|---|---|---|---|---|
Agriculture, Food, and Natural Resources | 0% | 0% | 0% | 0% | 0% |
Architecture and Construction | 0% | 0% | 0% | 0% | 0% |
Business and Marketing | 1% | 1% | 2% | 2% | 1% |
Communication and Audio / Visual Technology | 0% | 1% | 1% | 1% | 0% |
Computer and Information Sciences | 1% | 2% | 2% | 2% | 1% |
Engineering and Technology | 1% | 1% | 1% | 0% | 2% |
English Language and Literature | 20% | 14% | 19% | 17% | 21% |
Fine and Performing Arts | 7% | 14% | 19% | 17% | 21% |
Foreign Language and Literature | 5% | 6% | 7% | 6% | 5% |
Health Care Sciences | 0% | 0% | 1% | 1% | 1% |
Hospitality and Tourism | 0% | 0% | 0% | 0% | 0% |
Human Services | 0% | 0% | 1% | 0% | 0% |
Life and Physical Sciences | 14% | 11% | 14% | 14% | 14% |
Manufacturing | 0% | 0% | 0% | 0% | 0% |
Mathematics | 17% | 16% | 18% | 18% | 17% |
Military Science | 0% | 0% | 0% | 0% | 0% |
Miscellaneous | 7% | 11% | 7% | 9% | 8% |
Nonsubject Specific | 0% | 0% | 0% | 0% | 0% |
Physical, Health, and Safety Education | 8% | 13% | 7% | 6% | 8% |
Public, Protective, and Government Services | 0% | 0% | 0% | 0% | 0% |
Religious Education and Theology | 0% | 0% | 0% | 0% | 0% |
Social Sciences and History | 17% | 12% | 18% | 17% | 17% |
Transportation, Distribution, and Logistics | 0% | 0% | 0% | 0% | 0% |
Total | 100% | 100% | 100% | 100% | 100% |
2018-19 Virtual Enrollments Percentage by Subject Area and LocaleTable C9.
Subject Area | City Pass Rate | Not Specified Pass Rate | Rural Pass Rate | Suburb Pass Rate | Town Pass Rate |
|---|---|---|---|---|---|
Agriculture, Food, and Natural Resources | 78% | NR | 71% | 78% | 85% |
Architecture and Construction | NR | NR | 86% | 24% | 96% |
Business and Marketing | 58% | 42% | 71% | 70% | 77% |
Communication and Audio / Visual Technology | 59% | 46% | 73% | 65% | 77% |
Computer and Information Sciences | 35% | 51% | 62% | 65% | 72% |
Engineering and Technology | 56% | 82% | 46% | 87% | 93% |
English Language and Literature | 49% | 39% | 47% | 56% | 55% |
Fine and Performing Arts | 57% | 70% | 45% | 65% | 66% |
Foreign Language and Literature | 55% | 41% | 51% | 56% | 62% |
Health Care Sciences | 77% | 48% | 78% | 45% | 65% |
Hospitality and Tourism | 69% | 47% | 70% | 49% | 69% |
Human Services | 74% | 49% | 86% | 72% | 87% |
Life and Physical Sciences | 47% | 40% | 46% | 59% | 55% |
Manufacturing | NR | NR | 76% | 79% | NR |
Mathematics | 50% | 35% | 45% | 53% | 51% |
Military Science | NR | NR | NR | 77% | NR |
Miscellaneous | 55% | 66% | 63% | 74% | 61% |
Nonsubject Specific | 64% | NR | 32% | 89% | 91% |
Physical, Health, and Safety Education | 56% | 68% | 57% | 64% | 64% |
Public, Protective, and Government Services | 58% | 63% | 71% | 64% | 76% |
Religious Education and Theology | NR | NR | 92% | 81% | NR |
Social Sciences and History | 50% | 39% | 52% | 62% | 57% |
Transportation, Distribution, and Logistics | NR | NR | 78% | 91% | NR |
Total | 51% | 50% | 51% | 60% | 58% |
2018-19 Virtual Enrollment Pass Rates by Subject Area and LocaleNote: Data are not reported (NR) is there were less than 25 virtual enrollments for that cell.Table C10.
Subject Area | # of Male Enrolls | # of Female Enrolls | % of Male Enrolls | % of Female Enrolls | Male Pass Rate | Female Pass Rate |
|---|---|---|---|---|---|---|
Agriculture, Food, and Natural Resources | 335 | 625 | 0% | 0% | 70% | 80% |
Architecture and Construction | 216 | 44 | 0% | 0% | 76% | 95% |
Business and Marketing | 4,195 | 4,377 | 1% | 1% | 68% | 69% |
Communication and Audio / Visual Technology | 1,429 | 1,856 | 0% | 1% | 65% | 68% |
Computer and Information Sciences | 6,656 | 4,454 | 2% | 1% | 60% | 57% |
Engineering and Technology | 2,465 | 1,738 | 1% | 1% | 63% | 60% |
English Language and Literature | 61,114 | 58,223 | 19% | 18% | 50% | 53% |
Fine and Performing Arts | 18,768 | 20,393 | 6% | 7% | 57% | 63% |
Foreign Language and Literature | 17,276 | 20,393 | 5% | 6% | 49% | 58% |
Health Care Sciences | 1,230 | 2,840 | 0% | 1% | 45% | 68% |
Hospitality and Tourism | 420 | 515 | 0% | 0% | 50% | 66% |
Human Services | 342 | 1,155 | 0% | 0% | 80% | 81% |
Life and Physical Sciences | 43,846 | 42,827 | 14% | 13% | 50% | 53% |
Manufacturing | 64 | 10 | 0% | 0% | 78% | NR |
Mathematics | 56,070 | 54,314 | 18% | 17% | 48% | 49% |
Military Science | 71 | 63 | 0% | 0% | 76% | 75% |
Miscellaneous | 26,093 | 26,564 | 8% | 8% | 64% | 67% |
Nonsubject Specific | 381 | 332 | 0% | 0% | 72% | 75% |
Physical, Health, and Safety Education | 23,719 | 24,712 | 7% | 8% | 59% | 63% |
Public, Protective, and Government Services | 825 | 1,249 | 0% | 0% | 61% | 72% |
Religious Education and Theology | 64 | 86 | 0% | 0% | 80% | 92% |
Social Sciences and History | 51,453 | 54,391 | 16% | 17% | 53% | 57% |
Transportation, Distribution, and Logistics | 98 | 27 | 0% | 0% | 84% | 85% |
Total | 317,130 | 322,000 | 100% | 100% | 53% | 57% |
2018-19 Number and Percentage of Virtual Enrollments with Pass Rates by Subject Area and Student SexNote: Pass Rate data are not reported (NR) if there were less than 25 virtual enrollments for that cell.Table C11.
Virtual Method | # of Enrolls | % of Enrolls | Pass Rate |
|---|---|---|---|
Blended Learning | 51,266 | 8% | 49% |
Digital Learning | 57,092 | 9% | 54% |
Online Course | 523,309 | 82% | 55% |
Missing | 7,463 | 1% | 54% |
Total | 639,130 | 100% | 55% |
2018-19 Number and Percentage of Virtual Enrollments with Pass Rate by Virtual Method
Appendix - D Student Tables
Note: Clicking on the orange hyperlinked table number will return to the section of the report that discusses the table.Table D1.
Grade Level | # of Students | % of Students | % Change from 17-18 |
|---|---|---|---|
K | 1,085 | 1% | +21% |
1 | 1,278 | 1% | +36% |
2 | 1,324 | 1% | +18% |
3 | 1,416 | 1% | +23% |
4 | 1,429 | 1% | +14% |
5 | 1,732 | 1% | +23% |
6 | 2,848 | 2% | +21% |
7 | 3,319 | 3% | -3% |
8 | 4,429 | 4% | -4% |
9 | 16,611 | 14% | +3% |
10 | 21,631 | 18% | +6% |
11 | 25,117 | 21% | +8% |
12 | 39,634 | 33% | +7% |
Total | 120,669 | 100% | +7% |
2018-19 Number of Virtual Students with Percent Year over Year ChangeNote: Because some students took courses across multiple grade levels, a student may be counted toward more than one grade level. The total row, however, reflects the number of unique students.Table D2.
Student Sex | # of Students | % of Students | # of Enrolls | % of Enrolls | Pass Rate |
|---|---|---|---|---|---|
Males | 59,593 | 49% | 317,130 | 50% | 53% |
Females | 61,089 | 51% | 322,000 | 50% | 57% |
Total | 120,669 | 100% | 639,130 | 100% | 55% |
2018-19 Number and Percentage of Students and Virtual Enrollments with Pass Rate by Student SexNote: A few students had enrollments where their sex was listed as male on some, but female on others.Table D3.
Race /Ethnicity | # of Students | % of Students | # of Enrolls | % of Enrolls | Pass Rate |
|---|---|---|---|---|---|
African American | 20,073 | 17% | 123,688 | 19% | 43% |
American Indian or Alaska Native | 1,073 | 1% | 5,375 | 1% | 52% |
Asian | 2,279 | 2% | 7,775 | 1% | 76% |
Hispanic or Latino | 9,287 | 8% | 52,457 | 8% | 49% |
Native Hawaiian or Pacific Islander | 115 | 0% | 445 | 0% | 57% |
White | 82,103 | 68% | 413,892 | 65% | 59% |
Two or More Races | 5,280 | 4% | 31,930 | 5% | 51% |
Unknown | 1,069 | 1% | 3,568 | 1% | 34% |
Total | 120,669 | 100% | 639,130 | 100% | 55% |
2018-19 Number and Percentage of Students and Virtual Enrollments with Pass Rates by Race/EthnicityNote: The total number of students exceeds the 120,669 number because a few students had enrollments across multiple schools where one school listed the student as one race/ethnicity, but the other school reported a different value. The unique total was used to emphasize the true number of virtual students.Table D4.
Poverty Status | # of Students | % of Students | # of Enrolls | % of Enrolls | Pass Rate |
|---|---|---|---|---|---|
Yes | 68,666 | 57% | 419,462 | 66% | 48% |
No | 51,870 | 43% | 219,105 | 34% | 69% |
Unknown | 133 | 0% | 563 | 0% | 6% |
Total | 120,669 | 100% | 639,130 | 100% | 55% |
2018-19 Number and Percentage of Students and Virtual Enrollments with Pass Rate by Poverty StatusNote: The total number of students exceeds the 120,669 number because a few students had enrollments across multiple schools where one school listed the student under a specific poverty status, but the other school left the status unknown. The unique total was used to emphasize the true number of virtual students.Table D5.
Poverty Status | Virtual Pass Rate | Non-Virtual Pass Rate | Virtual Pass Rate - Non-Virtual Pass Rate |
|---|---|---|---|
Yes | 48% | 68% | -20% |
No | 69% | 85% | -16% |
Unknown | 6% | 21% | -15% |
Total | 55% | 76% | -21% |
2018-19 Pass Rate Comparison for Virtual Learners for Their Virtual and Non-Virtual Courses by Poverty StatusTable D6.
Virtual Type | % of Virtual Learners in Poverty | % of Virtual Enrolls from Learners in Poverty | Pass Rate for Virtual Learners in Poverty |
|---|---|---|---|
Full-Time Virtual | 67% | 69% | 43% |
Part-Time Virtual | 54% | 63% | 52% |
Total | 57% | 66% | 48% |
2018-19 Percentage of Virtual Learners and Virtual Enrollments in Poverty with Pass Rate by Virtual TypeTable D7.
Special Education Status | # of Students | % of Students | # of Enrolls | % of Enrolls | Pass Rate |
|---|---|---|---|---|---|
Yes | 13,864 | 11% | 83,328 | 13% | 48% |
No | 106,031 | 88% | 552,234 | 86% | 56% |
Unknown | 1,069 | 1% | 3,568 | 1% | 34% |
Total | 120,669 | 100% | 639,130 | 100% | 55% |
2018-19 Number and Percentage of Students and Virtual Enrollments with Pass Rate by Special Education StatusNote: The total number of students exceeds the 120,669 number because a few students had enrollments across multiple schools where one school listed the student under a specific special education status, but the other school left the status unknown. The unique total was used to emphasize the true number of virtual students.Table D8.
Virtual Subset | # of Students | % of Students | # of Enrolls | % of Enrolls | Pass Rate |
|---|---|---|---|---|---|
Full-Time - Virtual | 31,176 | 26% | 295,234 | 46% | 49% |
Part-Time Virtual | 91,181 | 76% | 343,896 | 54% | 60% |
Total | 120,669 | 100% | 639,130 | 100% | 55% |
2018-19 Number and Percentage of Virtual Enrollments with Pass Rate by Full- or Part-Time StatusTable D9.
Virtual Subset | Virtual Pass Rate | Non-Virtual Pass Rate |
|---|---|---|
Full-Time Virtual | 49% | NA |
Part-Time Virtual | 60% | 76% |
Total | 55% | 76% |
2018-19 Pass Rate Comparison for Full- and Part-Time Virtual LearnersTable D10.
Non-Virtual Performance | # of Students | % of Students | # of Enrolls | % of Enrolls | Pass Rate |
|---|---|---|---|---|---|
Passed All NV Courses | 35,490 | 47% | 83,557 | 35% | 82% |
Did Not Pass 1 or 2 NV Courses | 14,398 | 19% | 43,049 | 18% | 67% |
Did Not Pass 3 or More NV Courses | 25,278 | 34% | 114,340 | 47% | 39% |
Total | 75,166 | 100% | 240,946 | 100% | 59% |
2018-19 Number and Percentage of Students and Virtual Enrollments with Pass Rate by Non-Virtual Performance (Minimum of 3 Non-Virtual Enrollments)Table D11.
Virtual Course Performance | # of Students | % of Students | # of Enrolls | % of Enrolls | Pass Rate |
|---|---|---|---|---|---|
Passed All | 59,188 | 49% | 196,323 | 31% | 100% |
Passed Some, But Not All | 33,818 | 28% | 305,701 | 48% | 50% |
Didn't Pass Any | 27,663 | 23% | 137,106 | 21% | 0% |
Total | 120,669 | 100% | 639,130 | 100% | 55% |
2018-19 Number and Percentage of Students and Virtual Enrollments by Virtual Course PerformanceTable D12.
# of Virtual Courses Not Passed | # of Students | % of Students |
|---|---|---|
1 to 2 | 11,367 | 41% |
3 to 4 | 3,737 | 14% |
5 to 6 | 5,105 | 18% |
7 to 8 | 2,310 | 8% |
9 to 10 | 1,366 | 5% |
11+ | 3,778 | 14% |
Total | 27,663 | 100% |
2018-19 Number and Percentage of Virtual Students Who Did Not Pass Any Virtual Courses by the Number of Virtual Courses They TookTable D13.
Virtual Usage | # of Students | % of Students | # of Enrolls | % of Enrolls | Pass Rate |
|---|---|---|---|---|---|
1 to 2 Virtual Courses | 53,619 | 44% | 76,061 | 12% | 76% |
3 to 4 Virtual Courses | 16,516 | 14% | 57,254 | 9% | 64% |
5 or More Virtual Courses | 50,534 | 42% | 505,815 | 79% | 51% |
Total | 120,669 | 100% | 639,130 | 100% | 55% |
2018-19 Number and Percentage of Students and Virtual Enrollments with Pass Rates by Virtual Usage
Appendix - E State Assessment Tables
Assessment Measure | Virtual Pass Rate | State Pass Rate |
|---|---|---|
Evidence-Based Reading & Writing (SAT) | 44% | 55% |
Mathematics (SAT) | 25% | 36% |
Science (M-STEP) | NR | NR |
Social Studies (M-STEP) | 37% | 47% |
2018-19 Comparison of Virtual and State Pass Rates on 11 Grade State Assessment MeasuresNote: Statewide assessment data were available from the MI School Data Portal. Table E2.
Assessment | Pass All NV Pass Rate | Did Not Pass 1 or 2 NV Pass Rate | Did Not Pass 3 or More NV Pass Rate |
|---|---|---|---|
Evidence-Based Reading & Writing (SAT) | 66% | 38% | 24% |
Mathematics (SAT) | 45% | 18% | 9% |
Science (M-STEP) | NR | NR | NR |
Social Studies (M-STEP) | 54% | 32% | 22% |
2018-19 State Assessment Proficiency Rates for Virtual Learners with Three or More Non-Virtual Enrollments by Non-Virtual PerformanceTable E3.
Assessment | Virt. Learners in Poverty | Virt. Learners Not in Poverty | All Virtual Learners |
|---|---|---|---|
Evidence-Based Reading & Writing (SAT) | 29% | 60% | 44% |
Mathematics (SAT) | 12% | 39% | 25% |
Science (M-STEP) | NR | NR | NR |
Social Studies (M-STEP) | 24% | 51% | 37% |
2018-19 State Assessment Proficiency Rates for Virtual Learners by Poverty StatusTable E4.
Assessment | Part-Time | Full-Time | All Virtual |
|---|---|---|---|
Evidence-Based Reading & Writing (SAT) | 46% | 30% | 44% |
Mathematics (SAT) | 27% | 8% | 25% |
Science (M-STEP) | NR | NR | NR |
Social Studies (M-STEP) | 39% | 25% | 37% |
2018-19 State Assessment Proficiency Rates for Virtual Learners by Virtual Type
Appendix – F Completion Status Tables
Completion Status | # of Enrolls | % of Enrolls |
|---|---|---|
Audited (No Credit Issued) | 10,957 | 2% |
Completed / Failed | 99,927 | 16% |
Completed / Passed | 350,594 | 55% |
Incomplete | 65,162 | 10% |
Ongoing Enrolled | 42 | 0% |
Testing Out | 112 | 0% |
Withdrawn / Exited | 64,013 | 10% |
Withdrawn / Failing | 16,334 | 3% |
Withdrawn / Passing | 31,989 | 5% |
Total | 639,130 | 100% |
2018-19 Number and Percentage of Virtual Enrollments by Completion StatusTable F2.
Completion Status | ISD School % of Enrolls | LEA School % of Enrolls | LEA UEP % of Enrolls | PSA School % of Enrolls |
|---|---|---|---|---|
Audited (No Credit Issued) | 0% | 3% | 0% | 1% |
Completed / Failed | 3% | 16% | 6% | 16% |
Completed / Passed | 60% | 58% | 69% | 49% |
Incomplete | 3% | 10% | 2% | 11% |
Ongoing Enrolled | 0% | 0% | 0% | 0% |
Testing Out | 0% | 0% | 0% | 0% |
Withdrawn / Exited | 28% | 9% | 19% | 10% |
Withdrawn / Failing | 0% | 1% | 0% | 6% |
Withdrawn / Passing | 5% | 4% | 2% | 7% |
Total | 100% | 100% | 100% | 100% |
2018-19 Percentage of Virtual Enrollments by Completion Status and Entity TypeNote: UEP = Unique Education ProviderTable F3.
Completion Status | # of Enrolls | % of Enrolls |
|---|---|---|
Audited (No Credit Issued) | 6,370 | 2% |
Completed / Failed | 44,470 | 15% |
Completed / Passed | 145,494 | 49% |
Incomplete | 35,678 | 12% |
Ongoing Enrolled | 0 | 0% |
Testing Out | 40 | 0% |
Withdrawn / Exited | 27,852 | 9% |
Withdrawn / Failing | 13,948 | 5% |
Withdrawn / Passing | 21,382 | 7% |
Total | 295,234 | 100% |
2018-19 Number and Percentage of Full-Time Virtual Enrollments by Completion StatusTable F4.
Completion Status | # of Enrolls | % of Enrolls |
|---|---|---|
Audited (No Credit Issued) | 4,587 | 1% |
Completed / Failed | 55,457 | 16% |
Completed / Passed | 205,100 | 60% |
Incomplete | 29,484 | 9% |
Ongoing Enrolled | 42 | 0% |
Testing Out | 72 | 0% |
Withdrawn / Exited | 36,161 | 11% |
Withdrawn / Failing | 2,386 | 1% |
Withdrawn / Passing | 10,607 | 3% |
Total | 343,896 | 100% |
2018-19 Number and Percentage of Part-Time Virtual Enrollments by Completion StatusTable F5.
Completion Status | Alt Ed % of Enrolls | Gen Ed % of Enrolls | Special Ed % of Enrolls |
|---|---|---|---|
Audited (No Credit Issued) | 3% | 0% | 0% |
Completed / Failed | 16% | 16% | 7% |
Completed / Passed | 42% | 65% | 52% |
Incomplete | 20% | 3% | 1% |
Ongoing Enrolled | 0% | 0% | 0% |
Testing Out | 0% | 0% | 0% |
Withdrawn / Exited | 14% | 7% | 41% |
Withdrawn / Failing | 1% | 3% | 0% |
Withdrawn / Passing | 5% | 5% | 0% |
Total | 100% | 100% | 100% |
2018-19 Percentage of Virtual Enrollments by Completion Status and School EmphasisNote: Reportable Programs and Vocational/CTE are not reporting on here because each had less than 10 schools.Table F6.
Completion Status | English % of Enrolls | Math % of Enrolls | Science % of Enrolls | Social Sci % of Enrolls |
|---|---|---|---|---|
Audited (No Credit Issued) | 2% | 2% | 2% | 2% |
Completed / Failed | 17% | 18% | 17% | 16% |
Completed / Passed | 51% | 49% | 51% | 55% |
Incomplete | 11% | 12% | 12% | 11% |
Ongoing Enrolled | 0% | 0% | 0% | 0% |
Testing Out | 0% | 0% | 0% | 0% |
Withdrawn / Exited | 10% | 11% | 10% | 10% |
Withdrawn / Failing | 3% | 3% | 3% | 2% |
Withdrawn / Passing | 6% | 5% | 4% | 4% |
Total | 100% | 100% | 100% | 100% |
2018-19 Percentage of Virtual Enrollments by Completion Status and Core Subject AreaTable F7.
Completion Status | Males % of Enrolls | Females % of Enrolls |
|---|---|---|
Audited (No Credit Issued) | 2% | 2% |
Completed / Failed | 17% | 14% |
Completed / Passed | 53% | 57% |
Incomplete | 10% | 10% |
Ongoing Enrolled | 0% | 0% |
Testing Out | 0% | 0% |
Withdrawn / Exited | 11% | 9% |
Withdrawn / Failing | 3% | 2% |
Withdrawn / Passing | 5% | 5% |
Total | 100% | 100% |
2018-19 Percentage of Virtual Enrollments by Completion Status and Student SexTable F8.
Completion Status | African American % of Enrolls | American Indian or Alaska Native % of Enrolls | Asian % of Enrolls | Hispanic or Latino % of Enrolls | White % of Enrolls | Two or More Races % of Enrolls |
|---|---|---|---|---|---|---|
Audited (No Credit Issued) | 4% | 2% | 1% | 1% | 1% | 1% |
Completed / Failed | 20% | 17% | 8% | 14% | 15% | 16% |
Completed / Passed | 43% | 52% | 76% | 49% | 59% | 51% |
Incomplete | 12% | 11% | 3% | 15% | 9% | 11% |
Ongoing Enrolled | 0% | 0% | 0% | 0% | 0% | 0% |
Testing Out | 0% | 0% | 0% | 0% | 0% | 0% |
Withdrawn / Exited | 11% | 13% | 5% | 12% | 9% | 11% |
Withdrawn / Failing | 3% | 2% | 2% | 3% | 2% | 4% |
Withdrawn / Passing | 7% | 4% | 5% | 5% | 4% | 6% |
Total | 100% | 100% | 100% | 100% | 100% | 100% |
2018-19 Percentage of Virtual Enrollments by Completion Status and Race / EthnicityNote: Only Race / Ethnicities with 1,000 or more students are reported in the table.Table F9.
Completion Status | In Poverty % of Enrolls | Not In Poverty % of Enrolls | Unknown % of Enrolls |
|---|---|---|---|
Audited (No Credit Issued) | 2% | 1% | 0% |
Completed / Failed | 18% | 11% | 3% |
Completed / Passed | 48% | 69% | 6% |
Incomplete | 12% | 7% | 18% |
Ongoing Enrolled | 0% | 0% | 0% |
Testing Out | 0% | 0% | 0% |
Withdrawn / Exited | 12% | 7% | 40% |
Withdrawn / Failing | 3% | 1% | 9% |
Withdrawn / Passing | 6% | 4% | 23% |
Total | 100% | 100% | 100% |
2018-19 Number and Percentage of Virtual Enrollments by Completion Status and Poverty StatusTable F10.
Completion Status | In Special Ed % of Enrolls | Not In Special Ed% of Enrolls | Unknown % of Enrolls |
|---|---|---|---|
Audited (No Credit Issued) | 1% | 2% | 3% |
Completed / Failed | 20% | 15% | 8% |
Completed / Passed | 48% | 56% | 34% |
Incomplete | 8% | 10% | 23% |
Ongoing Enrolled | 0% | 0% | 0% |
Testing Out | 0% | 0% | 0% |
Withdrawn / Exited | 12% | 10% | 19% |
Withdrawn / Failing | 4% | 2% | 4% |
Withdrawn / Passing | 6% | 5% | 10% |
Total | 100% | 100% | 100% |
2018-19 Number and Percentage of Virtual Enrollments by Completion Status and Special Education StatusTable F11.
Completion Status | At Least One % of Enrolls | 11 or More % of Enrolls |
|---|---|---|
Audited (No Credit Issued) | 4% | 4% |
Completed / Failed | 28% | 30% |
Completed / Passed | 0% | 0% |
Incomplete | 20% | 23% |
Ongoing Enrolled | 0% | 0% |
Testing Out | 0% | 0% |
Withdrawn / Exited | 28% | 22% |
Withdrawn / Failing | 7% | 7% |
Withdrawn / Passing | 12% | 15% |
Total | 100% | 100% |
2018-19 Percentage of Virtual Enrollments by Completion Status for Students Who Did Not Pass Any of Their Virtual Courses