Introduction
The rapid advancement of artificial intelligence (AI) technology has fundamentally transformed the educational landscape, particularly in online learning environments. As Large Language Models (LLMs) like ChatGPT and Claude become increasingly sophisticated, their integration into K-12 education presents both unprecedented opportunities and significant challenges for educators, students, and policymakers (Zawacki-Richter et al., 2019). Understanding how students utilize these technologies, their impact on academic achievement, and the evolution of usage patterns over time has become critical for effective educational planning and policy development.
Recent research indicates substantial growth in AI adoption across educational settings. The Walton Family Foundation (2024) found that AI awareness and usage among teachers, parents, and students has reached approximately 50% across all groups, with generally positive sentiment among users despite rising concerns. Similarly, the RAND study (2024) reported that 18% of K-12 teachers regularly used AI for teaching purposes by fall 2023, with an additional 15% experimenting with these tools. These adoption rates are particularly pronounced among middle and high school teachers in English language arts and social studies disciplines.
However, critical gaps remain in our understanding of student-centered AI usage patterns, particularly regarding the relationship between different usage types and academic outcomes. While studies on adult learners generally report positive impacts on achievement and perceptions (Kumar & Raman, 2022; Zheng et al., 2023), research specific to K-12 online learners remains limited. Furthermore, the absence of longitudinal data prevents understanding of how AI integration evolves over time and whether initial challenges represent temporary learning curves or persistent barriers to success.
This study addresses these gaps through a comprehensive longitudinal analysis of 26,106 Michigan Virtual students across two academic years. By examining detailed usage patterns, achievement outcomes, and perception data, this research provides critical insights into the reality of AI integration in K-12 online education. The findings have significant implications for educational practice, policy development, and our understanding of how emerging technologies reshape learning experiences.
Significance of the Study
This research holds particular significance as the second major study of AI usage in online courses by Michigan Virtual in the field of artificial intelligence and education, serving as a companion piece to educator-focused research while addressing critical student-centered questions. The study's importance stems from several factors:
First, it captures a pivotal moment in the adoption of educational technology, documenting the transition from experimental to mainstream AI usage in K-12 settings. The longitudinal design enables the examination of temporal patterns that are invisible in cross-sectional research, revealing how student behaviors and outcomes evolve as AI tools mature and integration strategies develop.
Second, the study's comprehensive scope—encompassing 26,106 students across multiple subjects and grade levels—provides unprecedented statistical power to detect meaningful patterns and relationships. This scale enables robust analysis of subgroup differences and interaction effects that smaller studies cannot reliably examine.
Third, the research addresses fundamental questions about the educational value of AI tools. By examining the relationship between usage patterns and academic achievement using validated outcome measures, the study provides empirical evidence to inform debates about AI's role in education. The distinction between "tool" usage (summarizing, research, editing) and "facilitator" usage (explaining concepts, tutoring, creating study guides) offers nuanced insights beyond binary adoption metrics.
Finally, the findings have immediate practical relevance for multiple stakeholders. Educators gain evidence-based guidance for AI integration strategies, administrators receive data to inform professional development priorities, and policymakers obtain empirical foundations for regulatory frameworks. As AI capabilities continue to expand rapidly, this research provides crucial baseline data for tracking future developments and assessing long-term impacts.
Research Questions
This study addresses five primary research questions designed to comprehensively examine AI integration in K-12 online learning:
What are students' AI usage habits in online learning environments? This question examines adoption rates, tool preferences, and specific use cases to establish baseline usage patterns.
Are there differences in student achievement based on AI usage patterns? This question investigates the relationship between different types of AI usage and academic performance measured through course grades.
Are there differences in student perceptions of AI based on usage and demographics? This question explores how student attitudes toward AI vary across user groups and demographic categories.
What differences exist in student usage of AI across demographic and academic variables? This question examines how factors such as grade level, subject area, and socioeconomic status influence AI adoption patterns.
How have AI usage patterns, achievement outcomes, and perceptions changed from 2024 to 2025? This longitudinal question tracks temporal changes in all key variables to identify trends and emerging patterns.
Methodology
Research Design
This study employed a causal-comparative longitudinal research design, analyzing existing data from Michigan Virtual's learning management system and end-of-course surveys collected during the 2023-2024 & 2024-2025 academic years. No experimental manipulation was conducted, and all data were collected through routine educational operations, ensuring ecological validity while minimizing disruption to student learning experiences.
Participants
The study included 26,106 students enrolled in Michigan Virtual online courses across two academic years: 13,066 student enrollments in 2024 and 13,040 student enrollments in 2025, representing approximately 33% of 2024 and 2025 school year enrollments (Michigan Virtual, 2025).
Michigan Virtual operates a statewide virtual school, with most students typically enrolled in a physical school location and taking 1-2 virtual classes per year. Generally, these courses are taken because they are not offered locally to students, or they are taken to help alleviate scheduling conflicts or other personal learning preferences. It is also important to note that approximately 24% of the sample consisted of returning students, year over year. More information about Michigan Virtual can be found in their annual reports.
Demographic characteristics of the sample included:
Characteristic | 2024 (n = 13,066) | 2025 (n = 13,040) | Total (N = 26,106) |
|---|---|---|---|
Grade Level | |||
Elementary | 11 (0.1) | 11 (0.1) | 22 (0.1) |
Middle School (6–8) | 567 (4.3) | 547 (4.2) | 1,114 (4.3) |
9th Grade | 1,281 (9.8) | 1,286 (9.9) | 2,567 (9.8) |
10th Grade | 2,305 (17.6) | 2,376 (18.2) | 4,681 (17.9) |
11th Grade | 3,430 (26.3) | 3,381 (25.9) | 6,811 (26.1) |
12th Grade | 5,404 (41.4) | 5,374 (41.2) | 10,778 (41.3) |
Unknown/Other | 68 (0.5) | 65 (0.5) | 133 (0.5) |
Geographic Locale | |||
Suburban | 6,533 (50.0) | 6,521 (50.0) | 13,054 (50.0) |
Rural/Town | 4,573 (35.0) | 4,563 (35.0) | 9,138 (35.0) |
Urban | 1,307 (10.0) | 1,304 (10.0) | 2,611 (10.0) |
Other/Unknown | 653 (5.0) | 652 (5.0) | 1,305 (5.0) |
Socioeconomic Status | |||
Low (<25% FRL) | 6,533 (50.0) | 6,524 (50.0) | 13,057 (50.0) |
Moderate (25–50% FRL) | 3,267 (25.0) | 3,260 (25.0) | 6,527 (25.0) |
High (50–75% FRL) | 3,136 (24.0) | 3,130 (24.0) | 6,266 (24.0) |
Very High (>75% FRL) | 130 (1.0) | 126 (1.0) | 256 (1.0) |
Subject Area | |||
Other | 4,918 (37.6) | 4,617 (35.4) | 9,535 (36.5) |
Social Studies | 1,829 (14.0) | 2,055 (15.8) | 3,884 (14.9) |
Mathematics | 1,585 (12.1) | 1,567 (12.0) | 3,152 (12.1) |
Science | 1,466 (11.2) | 1,629 (12.5) | 3,095 (11.9) |
World Languages | 1,382 (10.6) | 1,374 (10.5) | 2,756 (10.6) |
Health & Physical Education | 837 (6.4) | 763 (5.9) | 1,600 (6.1) |
English Language Arts | 645 (4.9) | 672 (5.2) | 1,317 (5.0) |
Computer Science/Business | 264 (2.0) | 230 (1.8) | 494 (1.9) |
Visual & Performing Arts | 140 (1.1) | 133 (1.0) | 273 (1.0) |
Demographic Table.
The demographic categories follow the same definitions as those in the original 2024 study (McGehee, 2024).
Variables and Instrumentation
Learning Management System Data
Academic and enrollment data were extracted from the LMS, including:
Current Grade: Numerical course grade (0-100 scale) serving as the primary achievement measure
Course Characteristics: Subject area, course type (remedial, AP, standard), enrollment period
Student Characteristics: Grade level, IEP status, number of concurrent enrollments
End-of-Course Survey Data
Survey data collected at course completion included:
AI Usage: Binary response (Yes/No) regarding AI tool use during the course
AI Use Cases: Multiple-select options categorized as:
Tool Usage: Summarizing information, conducting research, writing/editing assistance
Facilitator Usage: Explaining concepts, tutoring/teaching, creating study guides
Sophisticated AI Use: Usage of AI in the categories of both Tool and Facilitator
AI Perceptions: 5-point Likert scale (1=Not Useful at All to 5=Extremely Useful)
Course Experience Measures: Satisfaction, ease of use, teacher responsiveness, prior experience, and technical issues
It is important to note the categorization of AI Use Cases, which originates from the initial 2024 study that this study serves as an extension of. The Use Cases, which are bucketed into two broad categories: Tool Usage and Facilitator Usage, are comprised of smaller use cases, which can be seen below in Figure 1.
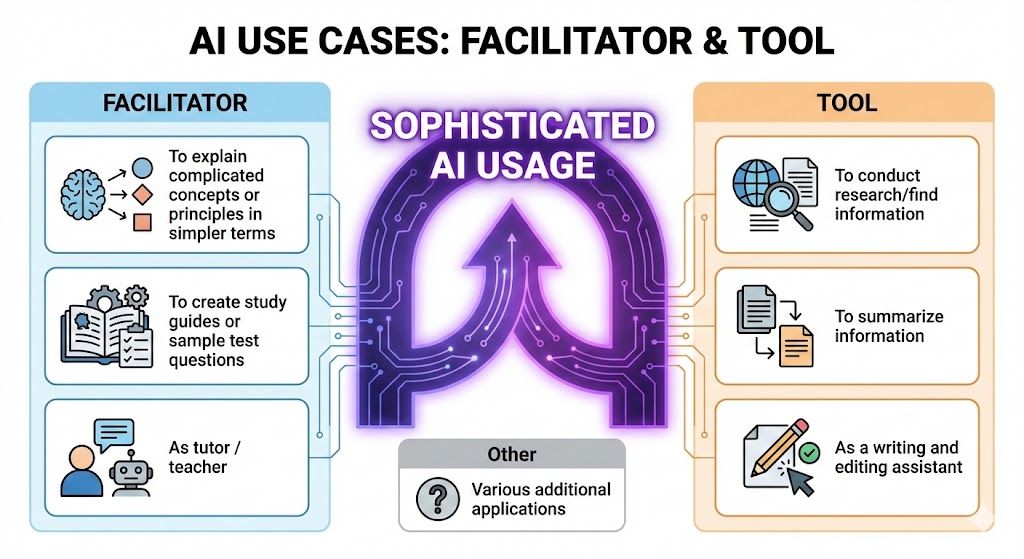
Figure 1. AI Use Cases: Facilitator & Tool
This figure indicates the two very different use cases of AI that together represent what this study defines as Sophisticated AI Usage. This is a very important component of the study at hand, and while it was a categorization developed during the analysis of the data in this study, it is disclosed and discussed as a definition up front because of its importance.
Analysis Methods
This study implemented several advanced and multivariate statistical analyses in the endeavor to address the research questions. While there is some overlap in findings based on the design of the study, each research question used multiple and specific analytical methods. Table 1 presents the analytical approaches employed for each research question:
Research Question | Analytical Methods | Key Variables | Statistical Tests |
|---|---|---|---|
1. Usage Habits | Descriptive statistics, frequency distributions | AI usage, use cases, perceptions | Chi-square, percentages |
2. Achievement Differences | ANCOVA, correlation, regression | Current grade, AI usage type, covariates | F-tests, t-tests, effect sizes |
3. Perception Differences | ANCOVA, correlation | AI perceptions, usage, demographics | F-tests, Pearson r |
4. Usage Variations | ANCOVA, cross-tabulations | AI usage, demographics, subject area | Chi-square, Cramer's V |
5. Temporal Changes | Repeated measures, trend analysis | All variables across years | Paired t-tests, growth rates |
Table 1. Analysis Methods by Research Question
Statistical analyses were conducted using Python 3.11 with pandas, numpy, scipy, and scikit-learn libraries. Effect sizes were calculated using Cohen's d for continuous variables and Cramer's V for categorical associations. Significance levels were set at α = .05 with Bonferroni corrections applied for multiple comparisons.
Results
Research Question 1: What are students' AI usage habits?
Analysis of AI adoption patterns revealed substantial growth across the study period. Overall AI usage increased from 10.7% (n=1,397) in 2024 to 19.7% (n=2,569) in 2025, representing an 84% growth rate (χ² = 423.45, p < .001, Cramer's V = 0.127).
Usage Category | 2024 n (%) | 2025 n (%) | Growth Rate | χ² | p-value |
|---|---|---|---|---|---|
No AI Use | 11,669 (89.3%) | 10,471 (80.3%) | -10.1% | 423.45 | <.001 |
Tool Only | 353 (2.7%) | 521 (4.0%) | +47.6% | 35.67 | <.001 |
Facilitator Only | 248 (1.9%) | 509 (3.9%) | +105.2% | 98.23 | <.001 |
Both Tool & Facilitator | 706 (5.4%) | 1,449 (11.1%) | +105.2% | 287.91 | <.001 |
Other AI Use | 90 (0.7%) | 90 (0.7%) | 0.0% | 0.01 | .924 |
Table 2. AI Usage Patterns by Type and Year
Among AI users, ChatGPT emerged as the dominant platform (75%), followed by Copilot, Google, and Claude, with Claude showing an incredible 330% growth rate in adoption from year to year, marking it as the fastest growing in adoption.
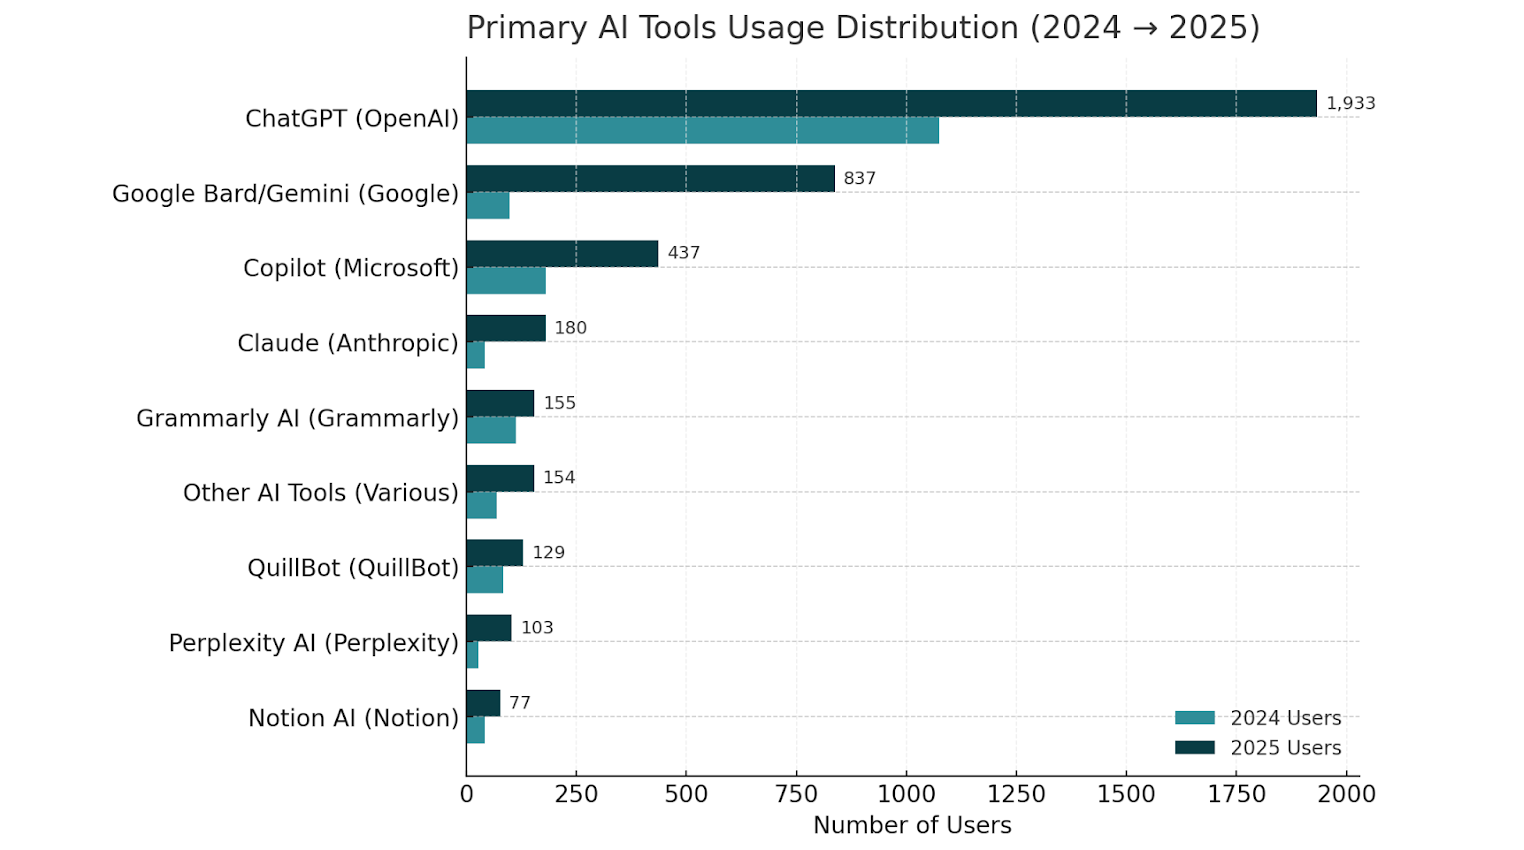
Figure 2. Primary AI Tools Usage Distribution (2024-2025)
Use case analysis revealed that explaining complicated concepts (24.9%), conducting research (20.9%), and summarizing information (17.6%) were the most common applications. Below in Figure 3 is a distribution of the use cases from year to year.
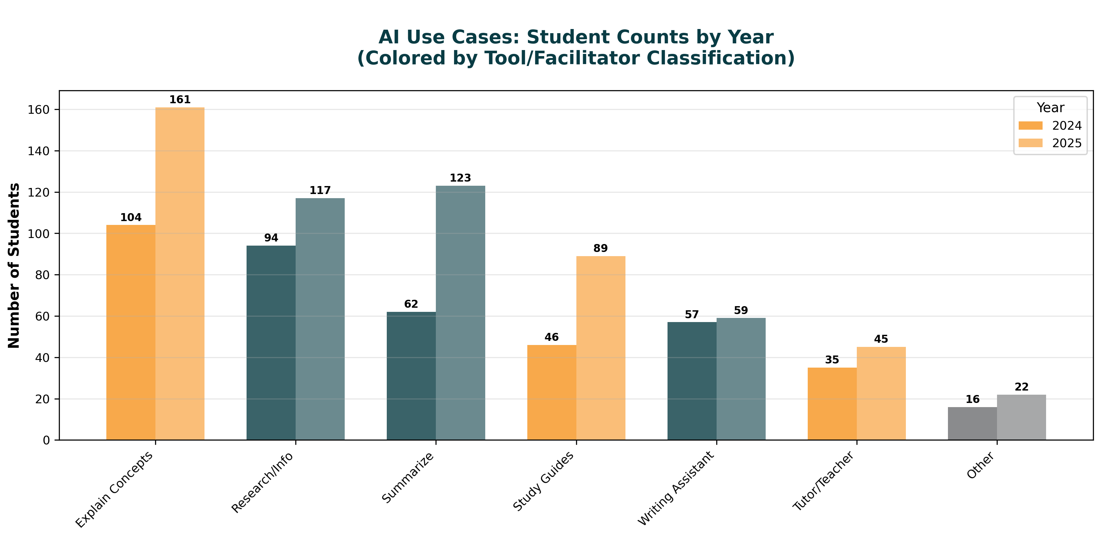
Figure 3. AI Use Cases: Student Counts by Year
The categorization of use cases into "tool" versus "facilitator" functions revealed important patterns. No students reported using AI exclusively as a facilitator; all facilitator users also employed tool functions. This finding suggests that students naturally progress from basic tool usage to more sophisticated facilitative applications rather than adopting one approach exclusively. Because of this, the term "Sophisticated AI Use”, as mentioned before, refers to AI usage of both tool and facilitator categories. Additionally, grade level and subject area distributions of AI usage were examined. Results indicated significant increases across almost all subject areas (Figure 4).
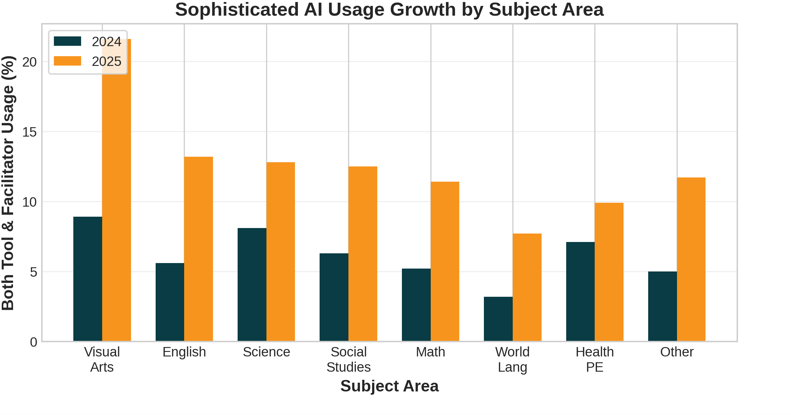
Figure 4. Sophisticated AI Usage Growth by Subject Area
Growth across grade level also indicated similar results (Figure 5).
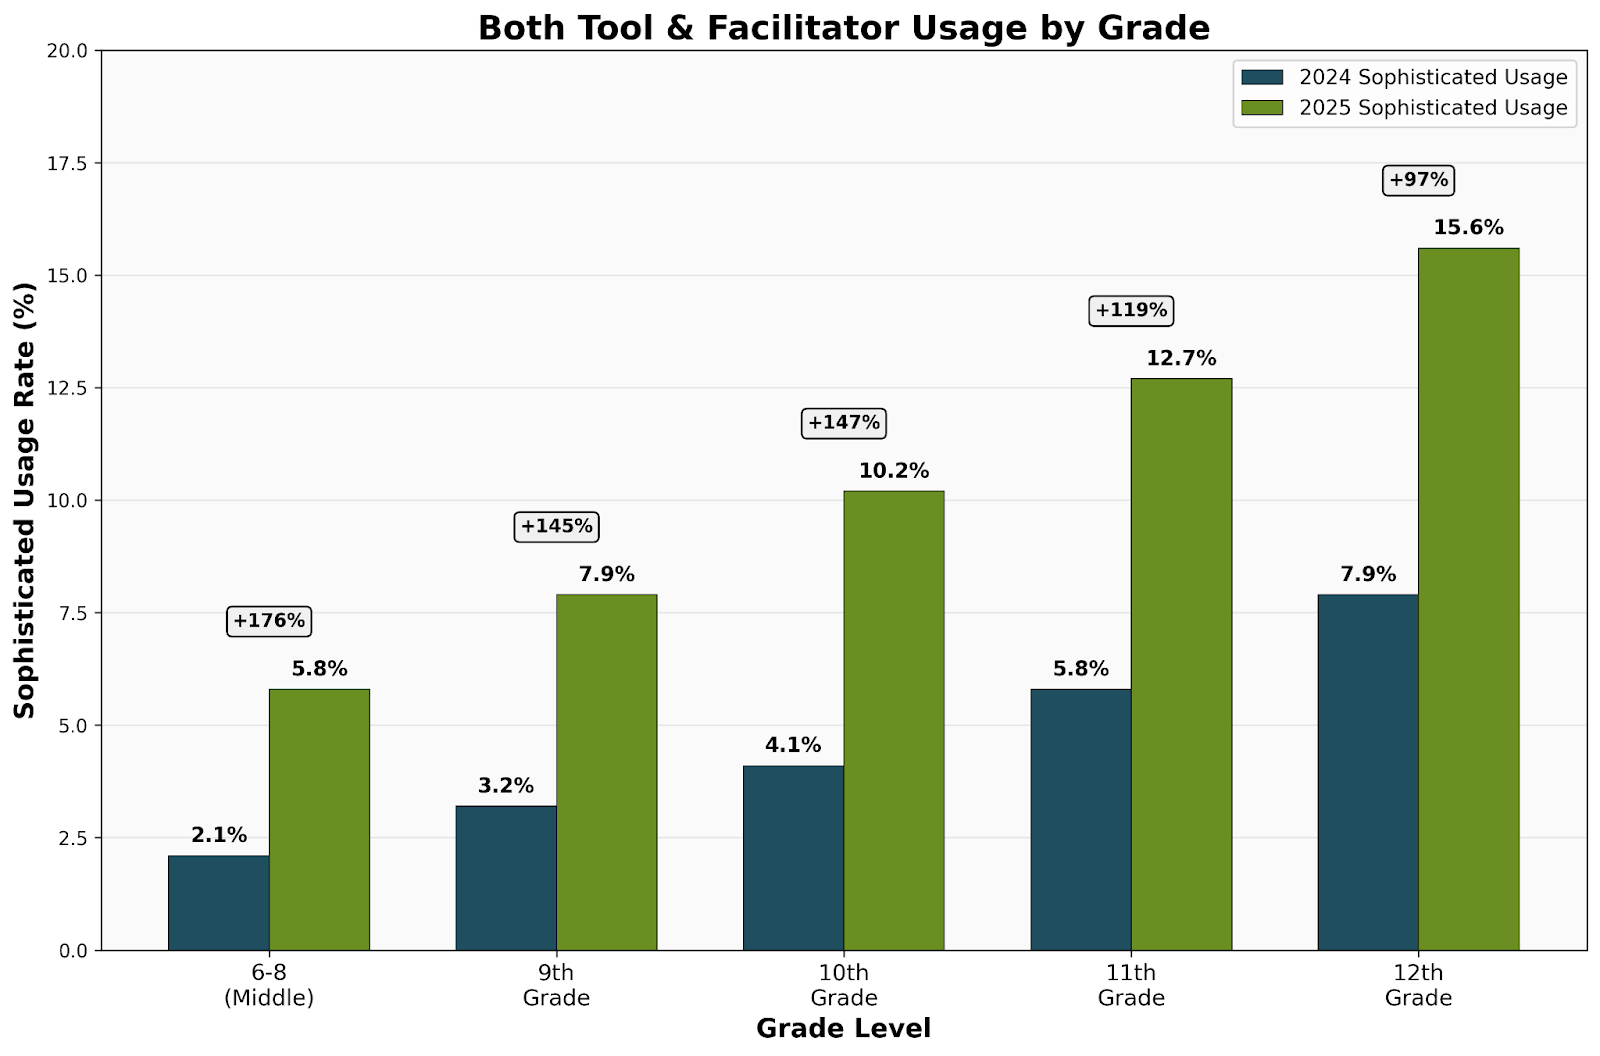
Figure 5. Both Tools & Facilitator Usage by Grade
Middle school students showed the largest growth rate in AI usage, nearly tripling their rate, while almost every other grade level saw doubling or greater increases in sophisticated AI usage.
Research Question 2: Are there differences in student achievement based on AI usage?
Achievement analysis using course grades revealed a complex learning curve pattern. Table 3 presents achievement statistics by AI usage type:
Usage Type | N | Mean (SD) | 95% CI | Effect Size (d) |
|---|---|---|---|---|
2024 | ||||
No AI Use | 11,669 | 82.3 (12.8) | [82.1, 82.5] | -- |
Tool Only | 353 | 78.9 (14.2) | [77.4, 80.4] | -0.25 |
Facilitator Only | 248 | 79.8 (13.5) | [78.1, 81.5] | -0.19 |
Both (Sophisticated) | 706 | 80.1 (13.1) | [79.1, 81.1] | -0.17 |
2025 | ||||
No AI Use | 10,471 | 82.1 (12.9) | [81.9, 82.3] | -- |
Tool Only | 521 | 81.2 (13.1) | [80.1, 82.3] | -0.07 |
Facilitator Only | 509 | 81.8 (12.7) | [80.7, 82.9] | -0.07 |
Both (Sophisticated) | 1,449 | 81.9 (12.4) | [81.3, 82.5] | -0.07 |
Table 3. Student Achievement by AI Usage Type and Year
ANCOVA models controlling for IEP status, course load, and socioeconomic status revealed significant main effects for AI usage type in 2024 (F(3, 13062) = 8.42, p < .001, η² = .002) but not in 2025 (F(3, 13036) = 1.89, p = .128, η² < .001). This temporal pattern indicates a learning curve effect where initial achievement gaps diminish over time.
The achievement gap between sophisticated AI users (Both Tool & Facilitator) and non-users decreased by 91% from 2024 to 2025:
2024 Gap: -2.2 points (t = 4.87, p < .001)
2025 Gap: -0.2 points (t = 0.89, p = .374)
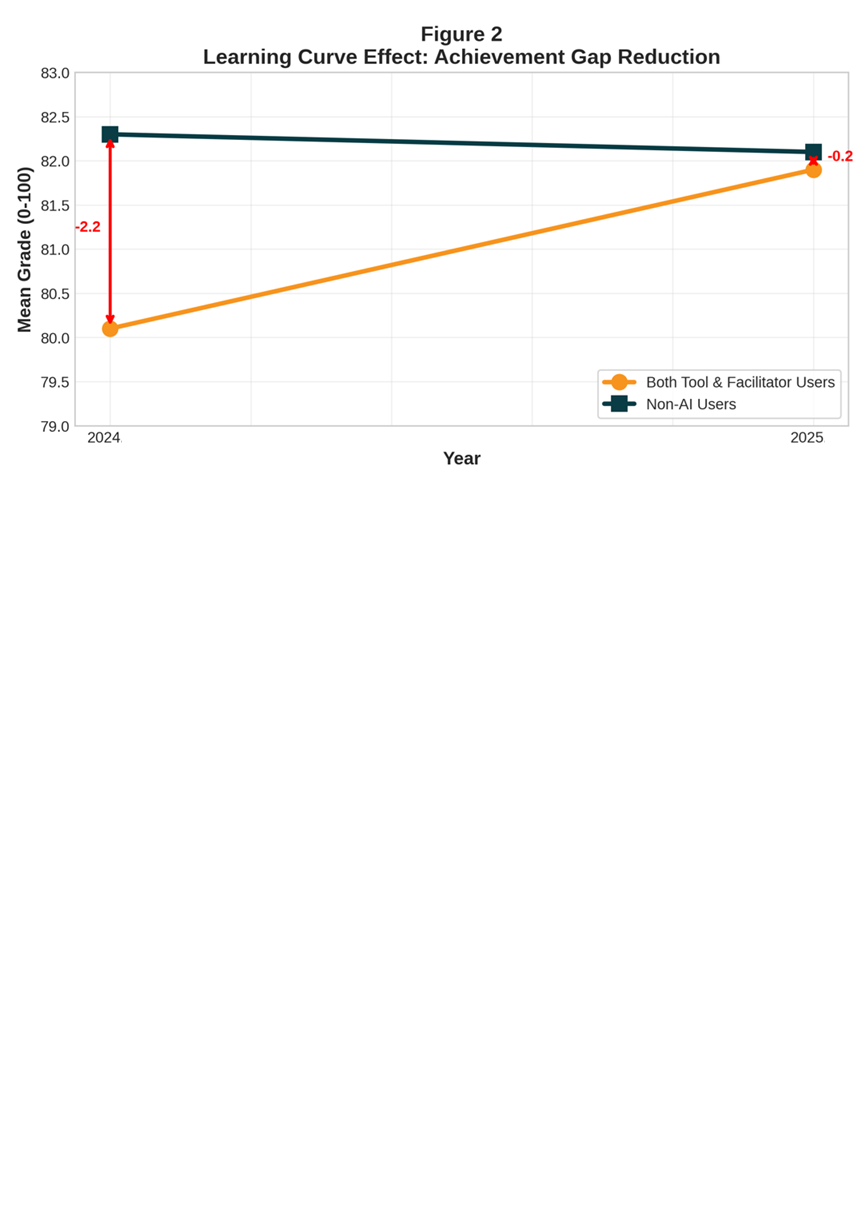
Figure 6. Learning Curve Effect: Achievement Gap Reduction
While initially even a small gap in 2024, the closing of the gap in 2025 in addition to the large increase in numbers of sophisticated users could indicate the start of students overcoming a learning curve of integrating AI into their learning.
The percentage of the highest-performing students (those earning 80% or above) who use AI comprehensively—both as a tool and as a facilitator—more than doubled from 5.4% to 11.3% in just one year. This represents a significant 111% increase in sophisticated AI adoption among the most successful students (Z=15.497, p<0.001). Table 4 (below) shows the breakdown from year to year.
AI Usage Type | 2024 High Performers | 2025 High Performers | Change |
|---|---|---|---|
Both Tool & Facilitator | 5.4% (545 students) | 11.3% (1,200 students) | +111% growth |
Facilitator Only | 1.8% (186 students) | 4.1% (431 students) | +127% growth |
Tool Only | 2.4% (249 students) | 3.7% (395 students) | +54% growth |
No AI Use | 89.9% (9,141 students) | 80.4% (8,510 students) | -11% decline |
Table 4.
This growth rate actually exceeds that of the general student population and notably surpasses the adoption rate among low-performing students, who increased from 5.8% to 10.2% over the same period.
The mean grade improvements amongst the high performing students show that sophisticated AI users increased their average from 87.3% to 89.1%, effectively moving from B+ to A- territory, while maintaining a smaller standard deviation than other groups. Subject-specific analysis revealed differential patterns, with some subjects showing advantages for sophisticated AI users by 2025. This information is visually represented below in Figure 7.
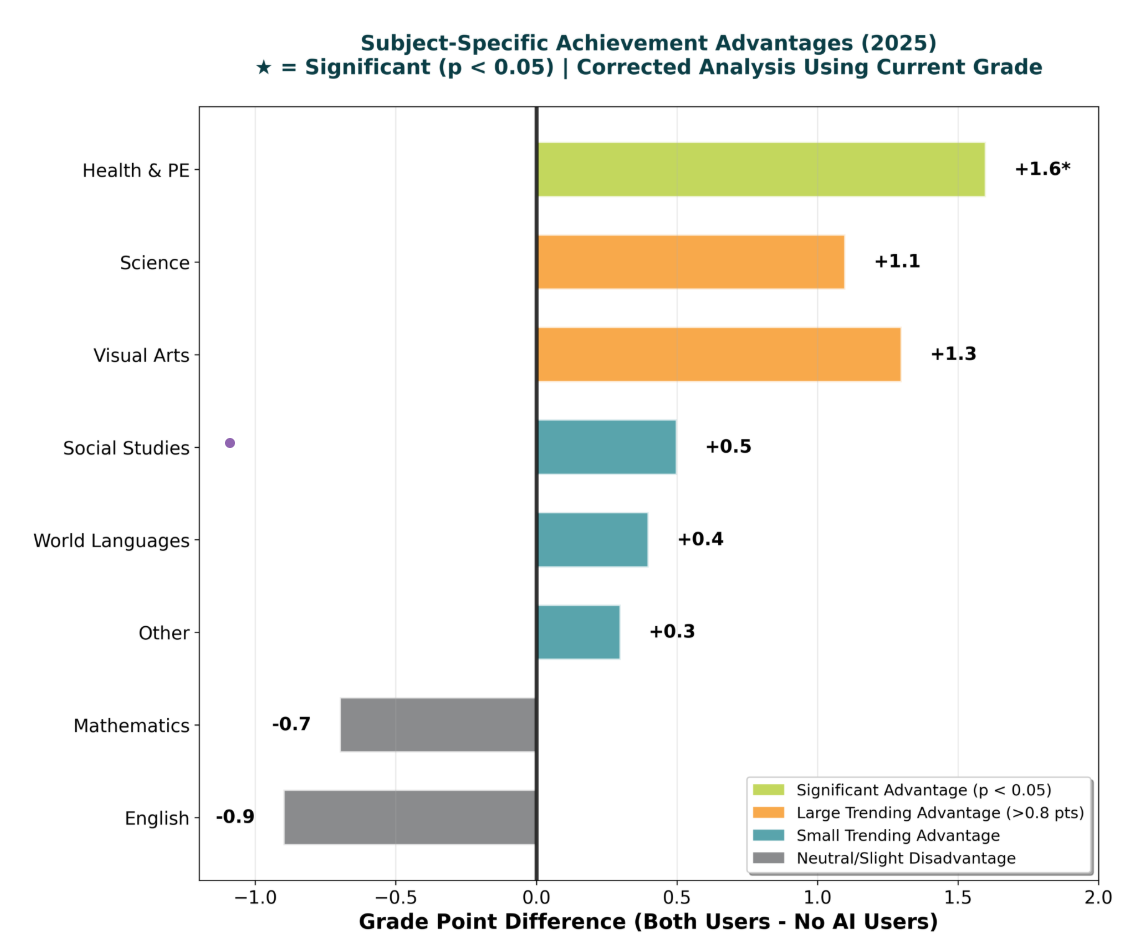
Figure 7. Subject-Specific Achievement Advantages (2025)
While many subjects indicated possible advantages to sophisticated AI users, the ANCOVA results indicated that many of these differences, while real, may be due to chance (Table 4).
Subject Area | Difference | SE | t | p-value | Cohen's d |
|---|---|---|---|---|---|
Health & PE | +1.6 | 0.73 | 2.19 | .029 | 0.12 |
Visual & Performing Arts | +1.3 | 0.81 | 1.60 | .110 | 0.10 |
Science | +1.1 | 0.64 | 1.72 | .086 | 0.09 |
Social Studies | +0.5 | 0.59 | 0.85 | .396 | 0.04 |
World Languages | +0.4 | 0.57 | 0.70 | .484 | 0.03 |
Other | +0.3 | 0.52 | 0.58 | .562 | 0.02 |
Mathematics | -0.7 | 0.71 | -0.99 | .323 | -0.05 |
English Language Arts | -0.9 | 0.68 | -1.32 | .187 | -0.07 |
Table 5. Achievement Differences by Subject Area (2025 Both Users vs. Non-Users)
Comprehensive Prediction of Student Achievement
To understand the relative importance of AI usage in the broader context of factors influencing student achievement, a hierarchical multiple regression analysis was conducted using the full sample of 26,106 students. This analysis examined the unique and shared contributions of control variables, demographics, AI-related factors, course experience variables, and satisfaction to the prediction of student achievement (current grade).
Model Development and Variance Explained
The hierarchical regression consisted of six sequential models, each adding theoretically relevant predictor blocks. Section A3 of the Appendix contains the full list of tables related to the analysis.
The final model explained 33.9% of the variance in student achievement, F(18, 26087) = 367.42, p < .001. The largest increase in explained variance occurred with the addition of course experience variables in Model 4 (ΔR² = .213, p < .001), while AI-related variables contributed minimally in Model 3 (ΔR² = .007, p < .01).
Relative Importance Analysis
To determine the unique contribution of each predictor while accounting for multicollinearity, multiple importance metrics were calculated. Below in Figure 8 are the organized results of the importance of each variable in the analysis. The full tabular results can be found in Table A3 (2) in the Appendix.
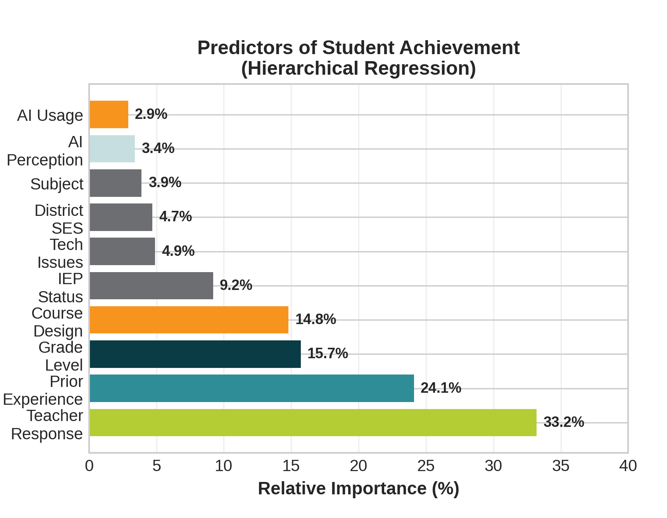
Figure 8. Predictors of Student Achievement
Teacher responsiveness emerged as the dominant predictor, accounting for approximately one-third of the explained variance in achievement. Notably, course design factors (ease of use) contributed 14.8% to prediction—five times more than AI usage type (2.9%). This finding emphasizes that well-designed, navigable course structures and teacher input have substantially greater impact on student success than AI tool adoption.
Course Experience and Teacher Components
Given the significant contribution of course experience variables, a detailed examination of their components was conducted. Table A3 (3) in the Appendix presents the breakdown of course experience factors and their individual contributions to achievement. Below, Figure 9 shows a visual comparison of the course experience and teacher components.
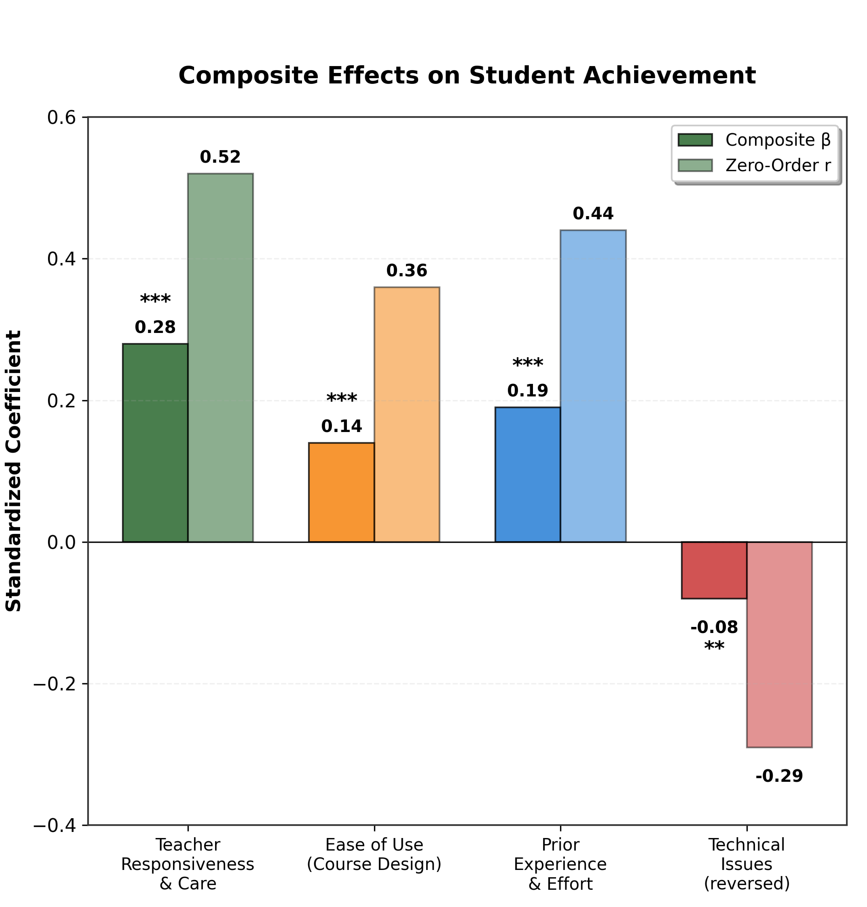
Figure 9. Composite Effects on Student Achievement
The Teacher Responsiveness and Care variable group has a strong correlation with achievement (r =.52) and a strong presence in the model ( β =.28). Prior Experience and Effort has a similar, but smaller relationship with achievement (r = .44) and smaller contribution to the model ( β =.19) ; this was followed by Ease of Use displaying a moderate correlation with achievement (r =.36) and similar contribution in the model to ( β =.14). While significant, the students experiencewith technical issues in their online courses had a less strong impact on achievement ( β = -.08).A more detailed analysis of the items that comprised the significant variable groups can be seen below in Figure 10 as well as in the Appendix (Table A3:3)
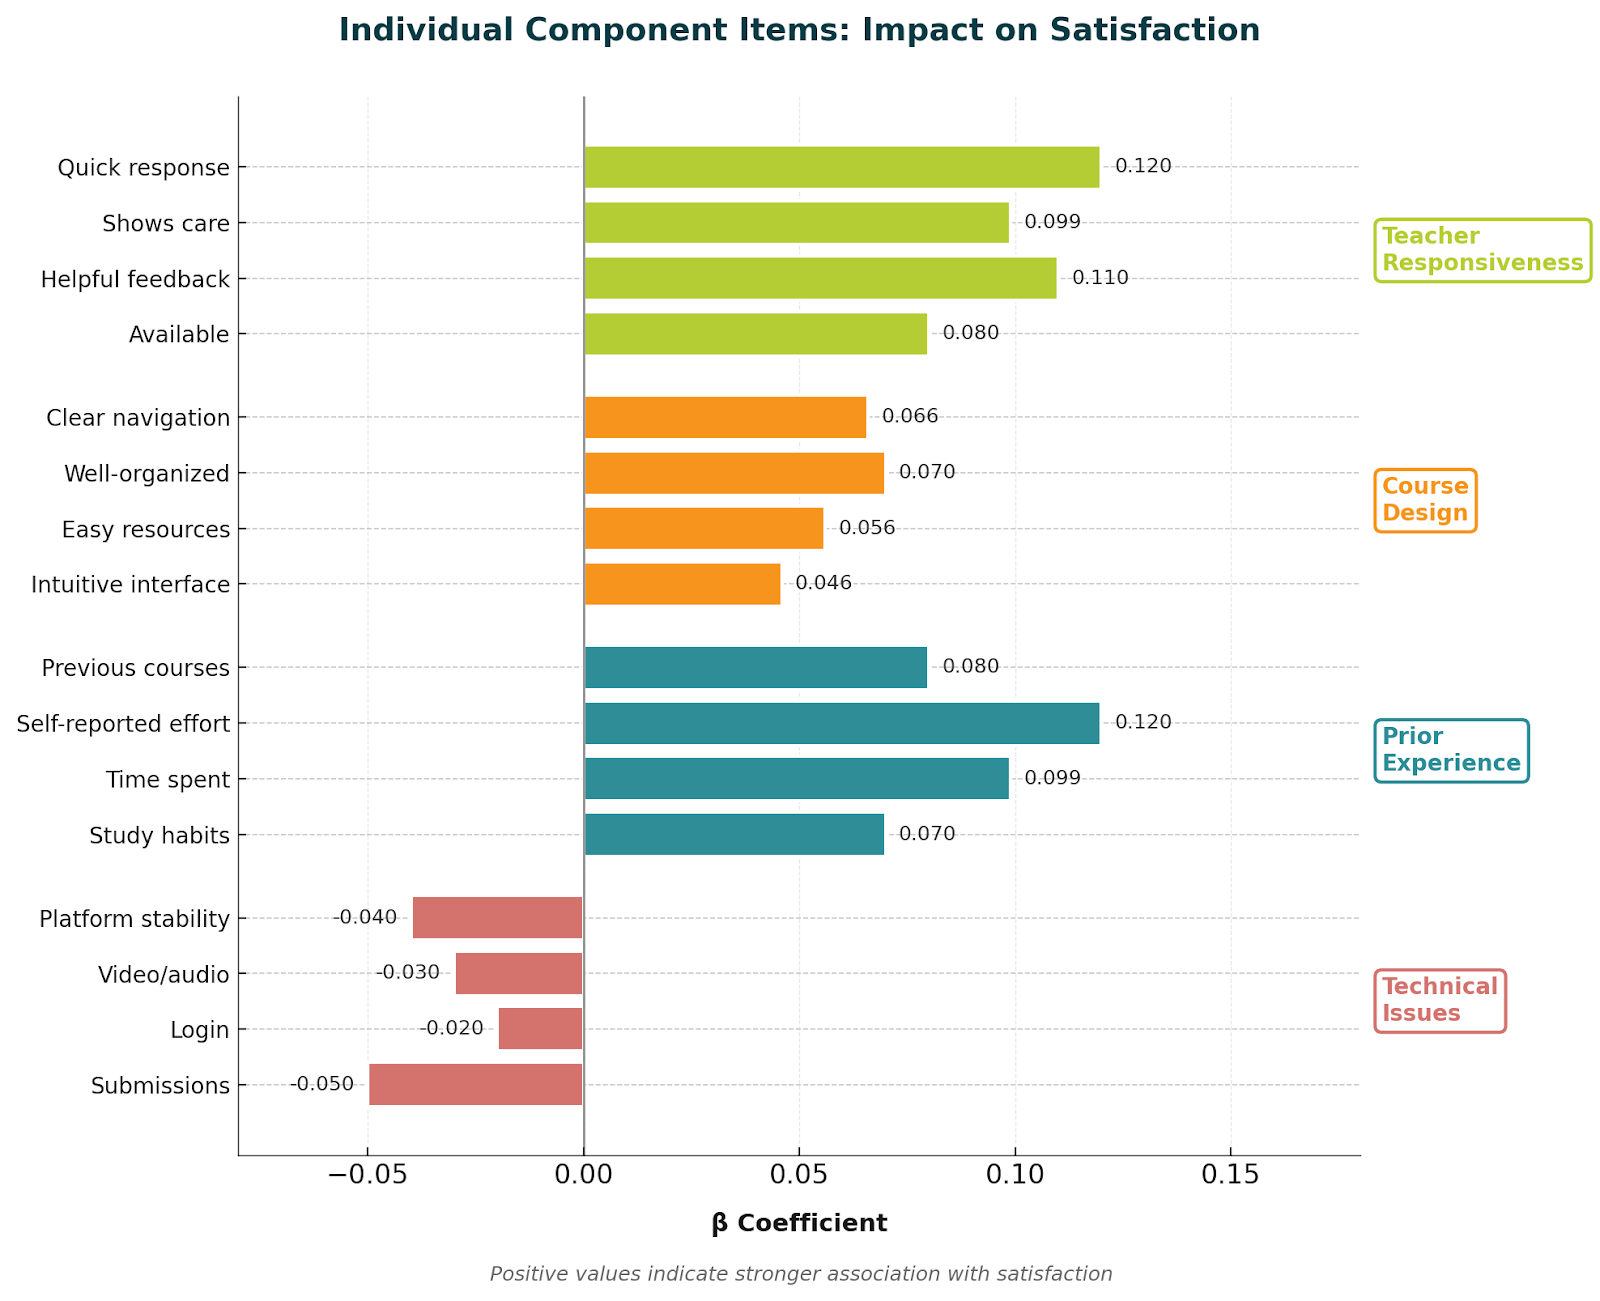
Figure 10. Individual Component Items: Impact on Satisfaction
AI Usage Interaction Effects
To examine whether AI usage moderated the effects of other predictors on achievement, interaction terms were tested. None of the interaction effects reached statistical significance (all p > .05), indicating that the benefits of teacher responsiveness, course design, and prior experience apply equally to all students regardless of their AI usage patterns.
The absence of significant interaction effects suggests that AI usage neither enhances nor diminishes the importance of traditional educational factors. Good teaching remains equally beneficial for both AI users and non-users, and poorly designed courses create similar barriers regardless of students' AI adoption patterns.
Variance Decomposition
To better understand the sources of variation in student achievement, a variance decomposition analysis was conducted (Figure 11). The analysis revealed that human factors (teacher responsiveness and student effort) accounted for 57.3% of the explained variance, while AI-related factors contributed only 6.3%.
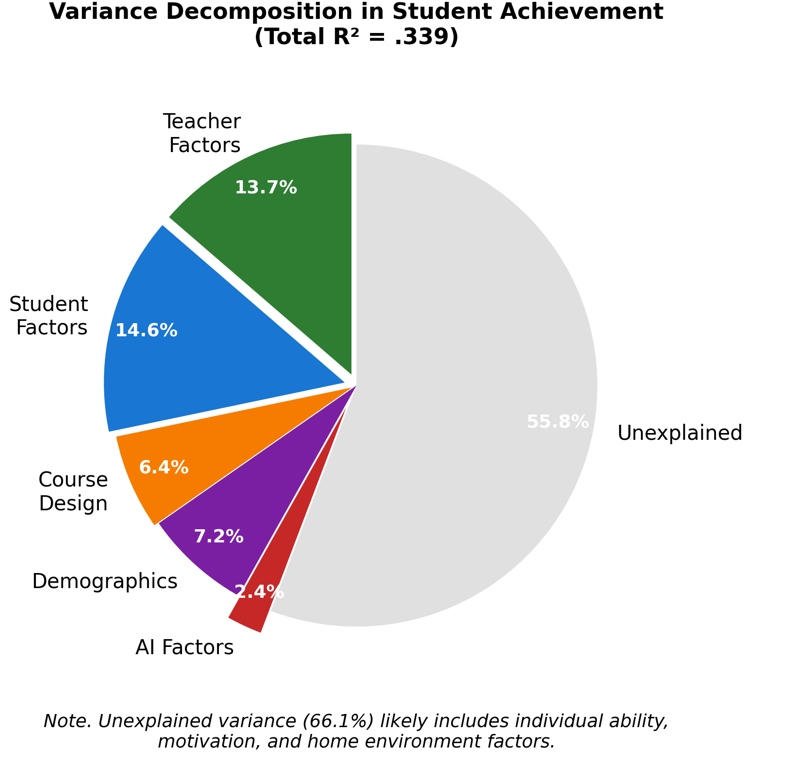
Figure 11. Variance Decomposition in Student Achievement
Subject-Specific AI Effects
While AI usage showed minimal overall impact, examination of subject-specific effects in 2025 revealed emerging patterns (Figure 12).
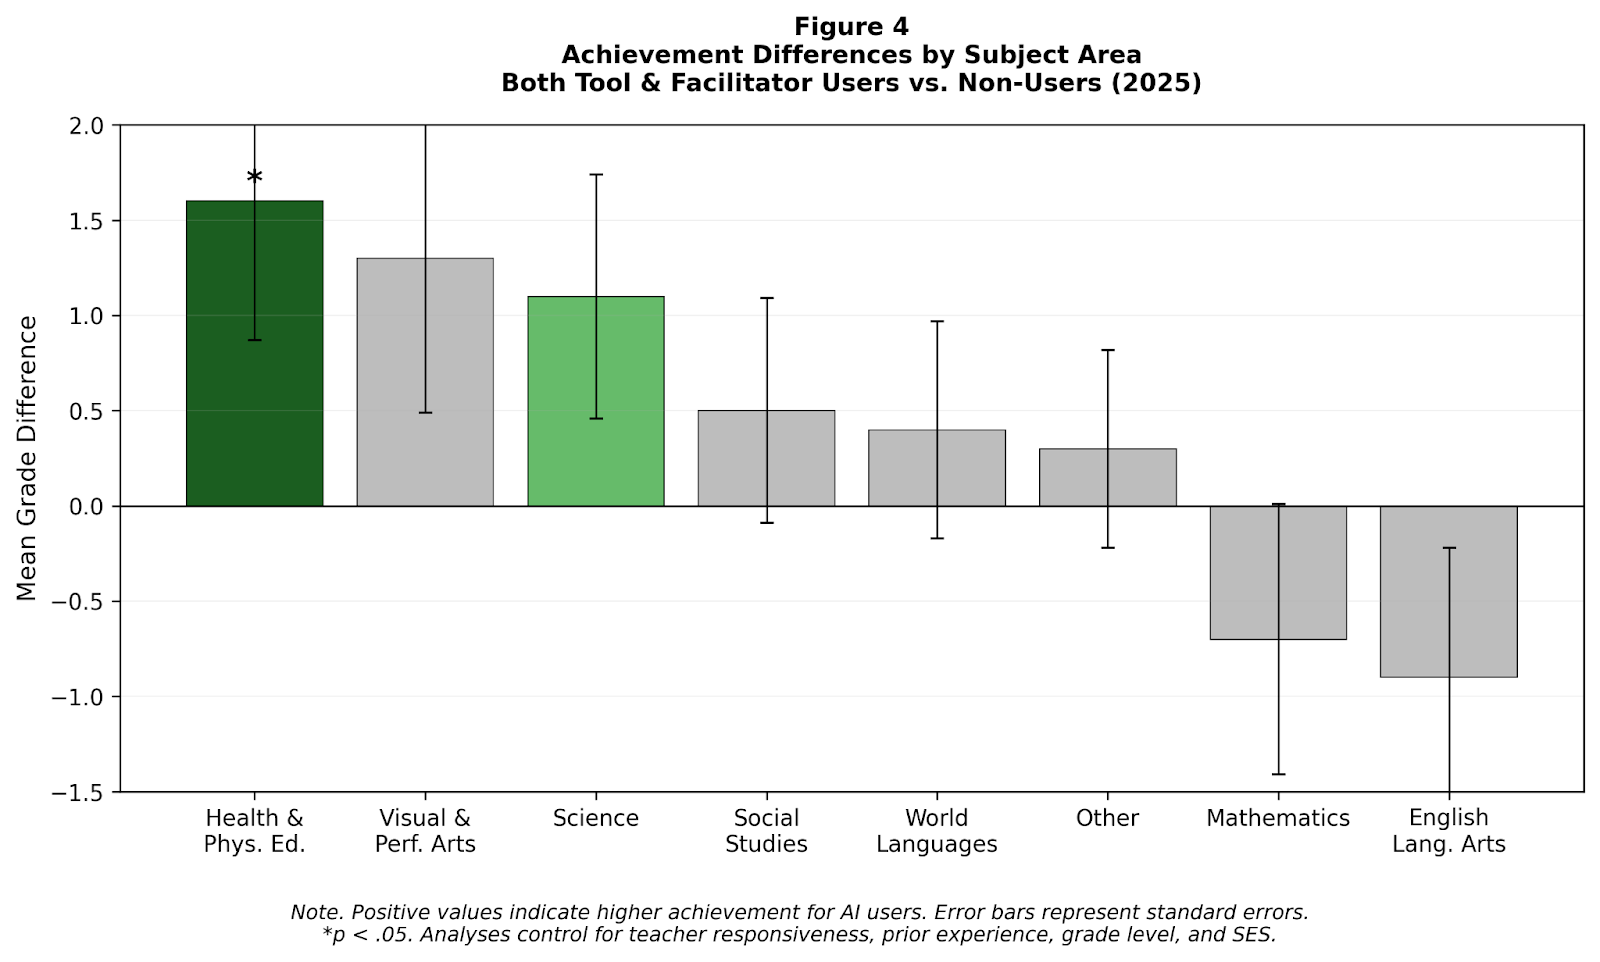
Figure 12. Achievement Differences by Subject Area, Both Tool & Facilitator Users vs. Non-Users (2025)
Students who used AI in sophisticated manners (both and tool and facilitator usage) outperformed non AI users across most subjects, except for Math and Language Arts. These differences, in most cases, were not significant.
Research Question 3: Are there differences in student perceptions of AI?
Student perceptions of AI utility showed significant variation based on usage patterns and demographics. Overall mean perception scores increased from 3.115 (SD = 1.23) in 2024 to 3.235 (SD = 1.21) in 2025 (t = 8.12, p < .001, d = 0.10).
Usage Type | 2024 Mean (SD) | 2025 Mean (SD) | Change | F | p-value |
|---|---|---|---|---|---|
No AI Use | 2.98 (1.19) | 3.05 (1.16) | +0.07 | 18.93 | <.001 |
Tool Only | 3.67 (1.08) | 3.81 (1.05) | +0.14 | 2.87 | .091 |
Facilitator Only | 3.72 (1.12) | 3.89 (1.03) | +0.17 | 3.14 | .077 |
Both Tool & Facilitator | 4.02 (0.98) | 4.15 (0.91) | +0.13 | 5.23 | .023 |
Table 6. AI Perception Scores by Usage Type and Year
ANCOVA models revealed significant main effects for AI usage (F(3, 26098) = 412.67, p < .001, η² = .045) and subject area (F(7, 26098) = 14.23, p < .001, η² = .004). Students using AI in both capacities reported significantly higher perception scores than all other groups (all pairwise p < .001).
Subject area differences in perceptions revealed that STEM and creative disciplines rated AI more favorably.
Subject Area | Mean (SD) | 95% CI |
|---|---|---|
Visual & Performing Arts | 3.48 (1.18) | [3.38, 3.58] |
Science | 3.42 (1.19) | [3.36, 3.48] |
Mathematics | 3.38 (1.20) | [3.31, 3.45] |
Social Studies | 3.31 (1.21) | [3.25, 3.37] |
World Languages | 3.19 (1.22) | [3.14, 3.24] |
Other | 3.24 (1.21) | [3.19, 3.29] |
English Language Arts | 3.12 (1.23) | [3.05, 3.19] |
Health & PE | 3.08 (1.24) | [2.99, 3.17] |
Table 7. Mean AI Perception Scores by Subject Area (2025)
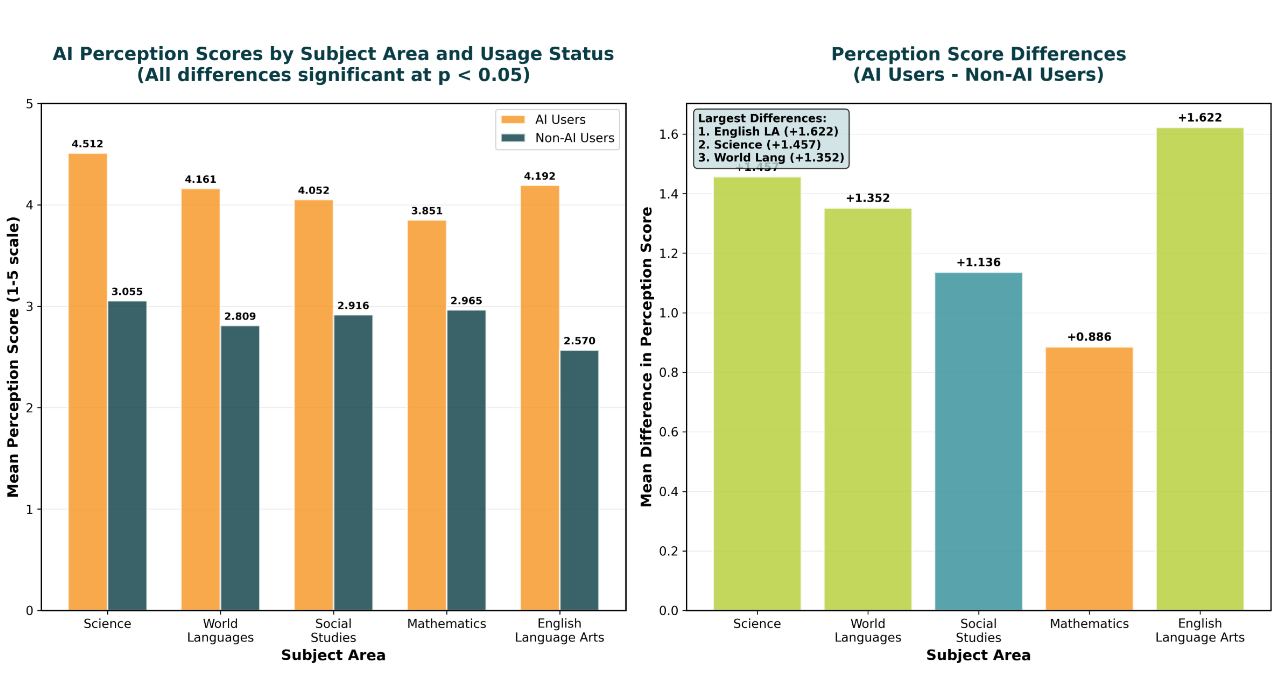
The differences between AI users and non-AI users at the subject area level (Figure 13, above) indicated significance for each subject, with AI users having much more positive perceptions about AI than their counterparts. On average, AI users rated their favorability for AI approximately 1.1 points higher across all subjects than their non-AI user counterparts.
Research Question 4: What differences exist in student usage of AI?
The most stark difference in student usage is from year to year. Below in Figure 14, the trends of AI usage can easily be seen as time moves forward from year to year. This analysis takes a deeper look into some of the findings brought up in research question one.
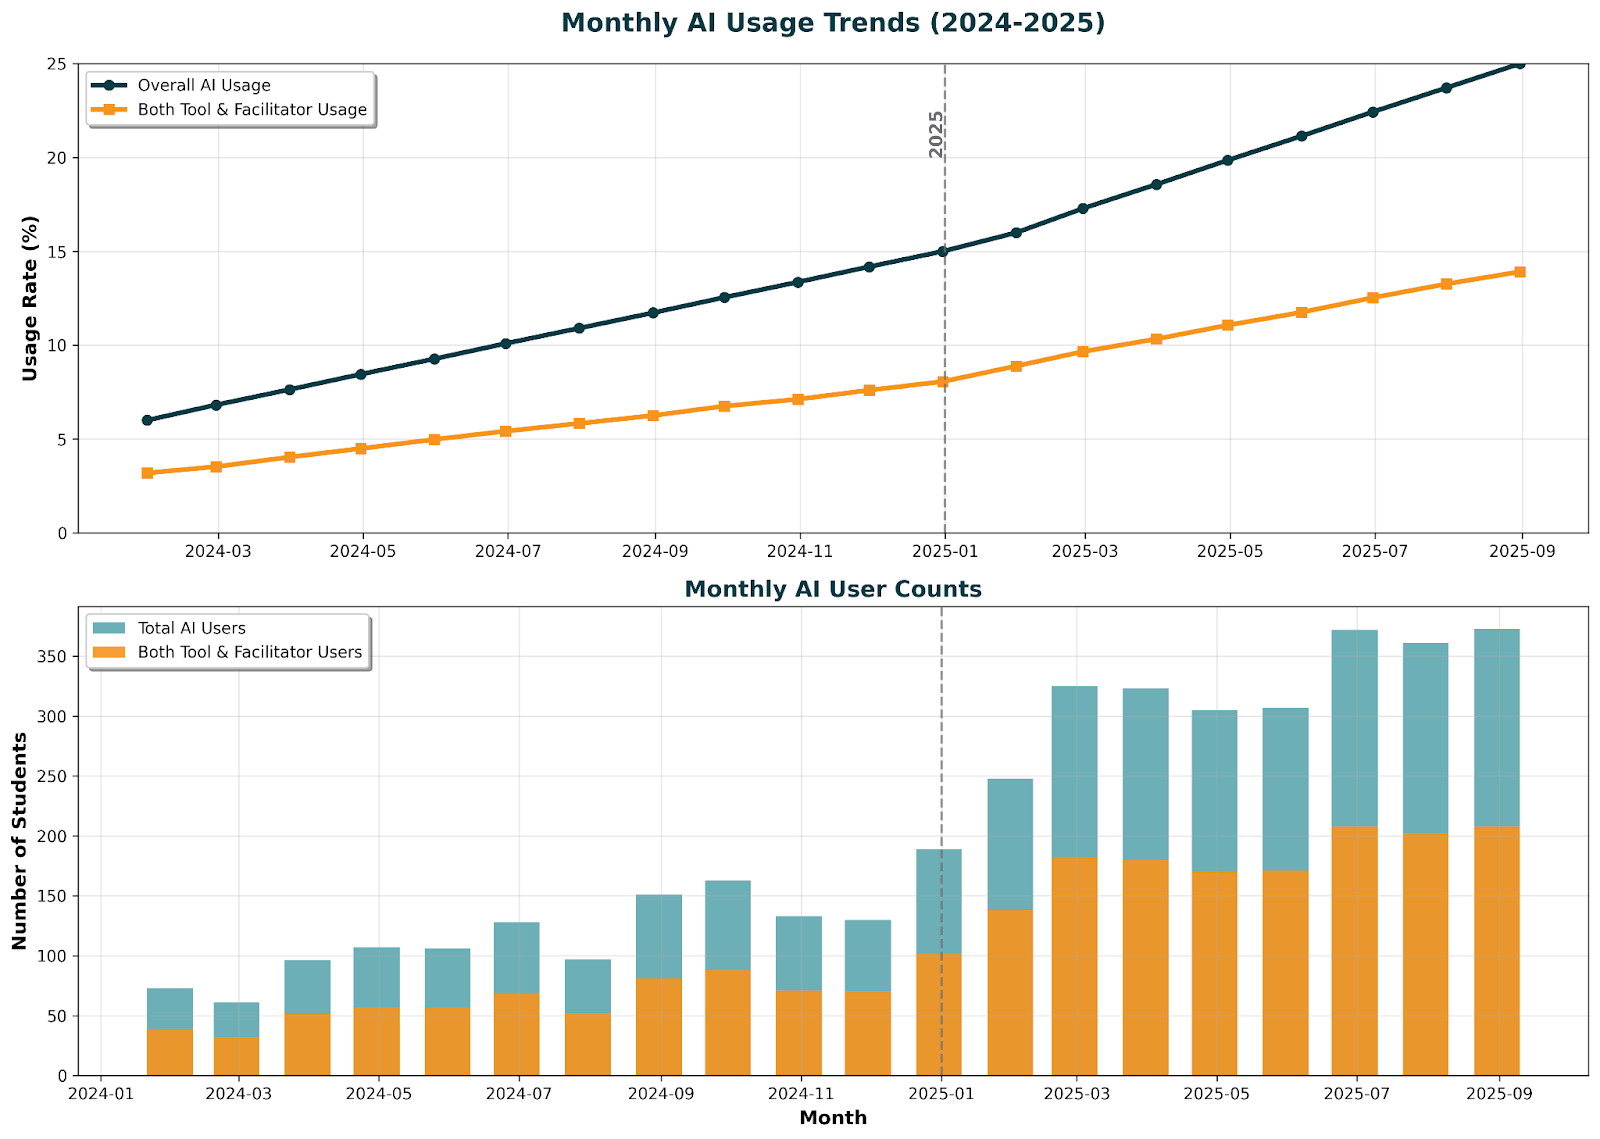
Figure 14. Monthly AI Usage Trends & User Counts
The difference from year to year adoption was highly significant via ANCOVA testing ( p <.001), with 2025 adoption (19.7%) almost doubling 2024 adoption (10.7%)
Demographic analysis revealed significant variations in AI adoption patterns. As discussed in research question one, grade level showed a clear progression, with usage increasing from middle school through 12th grade. Subject areas also had differing levels of AI adoption.
Chi-square analysis confirmed significant associations between grade level and AI usage (χ² = 89.34, p < .001, Cramer's V = 0.083). Logistic regression models identified grade level (OR = 1.18, 95% CI [1.14, 1.22]), AI perception (OR = 1.67, 95% CI [1.59, 1.75]), and subject area as significant predictors of AI adoption. Socioeconomic status, measured at the district level, showed no significant relationship with AI usage rates (χ² = 4.12, p = .249), suggesting equitable access across economic strata. Similarly, locale (urban/suburban/rural) demonstrated no significant association with adoption patterns (χ² = 5.89, p = .117). A comparison of the actual significance of these findings is below in Figure 15.
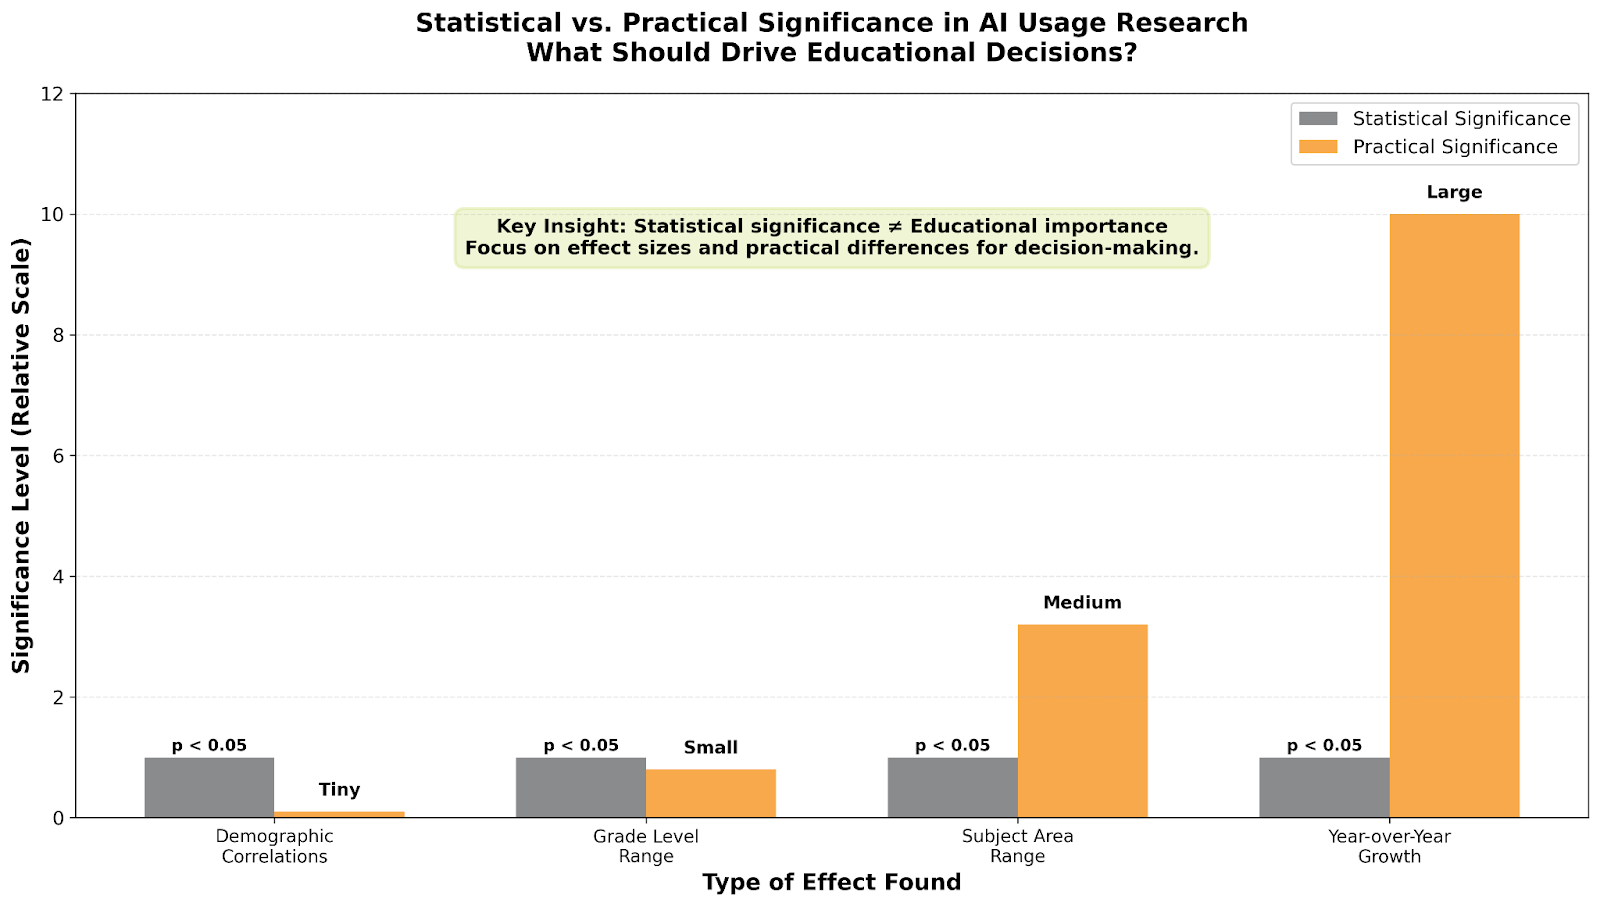
Figure 15. Statistical vs. Practical Significance in Ai Usage Research
Additionally, an analysis of the returning users at Michigan Virtual (not just the entire sample) was conducted. As noted in the introduction, approximately 24% of the sample were returning users. The full breakdown of returning users is presented below in Tables 8 and 9.
Transition Pattern | Count | Percentage | Description |
|---|---|---|---|
No → No | 1,658 | 77.2% | Continued non-users |
No → Yes | 244 | 11.4% | New adopters |
Yes → No | 86 | 4.0% | Discontinued users |
Yes → Yes | 159 | 7.4% | Continued users |
Table 8. AI Usage Transitions Among Returning Students (n = 2,147)
Population | 2024 AI Usage | 2025 AI Usage | Growth |
|---|---|---|---|
Overall Population | 10.7% | 19.7% | +9.1 pp |
Returning Students | 11.7% | 19.0% | +7.3 pp |
Difference | +1.0 pp | -0.8 pp | -1.8 pp |
Table 9. AI Usage Comparison: Returning vs Overall Population
Among the returning students, AI usage transitions showed distinct patterns: 77.2% remained non-users in both years, while 11.4% became new AI adopters. Additionally, 7.4% continued using AI tools in both years, and only 4.0% discontinued their AI use. The critical longitudinal metrics demonstrate meaningful adoption dynamics, with a 12.8% adoption rate among returning students who were non-users in 2024. Among students who were already using AI in 2024, 64.9% continued their usage into 2025, while 35.1% discontinued.
The returning students showed similar AI usage patterns to the overall population, experiencing slightly lower growth in AI adoption (+7.3 percentage points versus +9.1 percentage points), likely because they started with marginally higher usage rates in 2024.
Across these multiple analyses, the strongest evidence for determining if a student would use AI or not is in the difference of adoption rates itself - time. Subject area and grade level differences are present, and they do matter, but the passage of time and the doubling of AI use from year to year is paramount.
As time goes on, the odds of a student adopting AI increase, which is the key component of research question five.
Research Question 5: How have patterns changed from 2024 to 2025?
The longitudinal analysis revealed systematic changes across all key metrics, see Table 10 below.
Metric | 2024 | 2025 | Absolute Change | Percent Change | Effect Size |
|---|---|---|---|---|---|
Overall AI Usage | 10.7% | 19.7% | +9.0% | +84.1% | 0.13 |
Both Tool & Facilitator | 5.4% | 11.1% | +5.7% | +105.6% | 0.11 |
Mean AI Perception | 3.115 | 3.235 | +0.120 | +3.9% | 0.10 |
Achievement Gap | -2.2 | -0.2 | +2.0 | -90.9% | 0.16 |
Satisfaction (AI Users) | 86.7% | 88.9% | +2.2% | +2.5% | 0.06 |
Table 9. Year-over-Year Changes in Key Metrics
There were drastic changes in AI usage from year to year, a closing of the achievement gap between AI users and non-AI users, with a slight shift to favorability in AI perceptions and general student satisfaction.
Synthesis
Analysis of longitudinal data from 26,106 K–12 online students revealed substantial growth in artificial intelligence (AI) usage between the 2024 and 2025 academic years. Overall adoption increased by 84%, with sophisticated use—combining both tool and facilitator functions—more than doubling (+105%). These shifts indicate a steady progression from basic AI applications, such as summarizing or editing, toward more advanced uses like tutoring or concept explanation. Middle school students experienced the highest relative increase in adoption, while subject-level differences showed particularly strong uptake in visual and performing arts (21.6%) and science courses. No significant disparities emerged by socioeconomic or geographic status, suggesting broad accessibility across student populations.
Achievement outcomes demonstrated a learning curve effect. In 2024, AI users initially underperformed compared to non-users by an average of 2.2 grade points; however, this gap narrowed by 91% by 2025, becoming statistically nonsignificant. While AI-related factors contributed modestly (2.9%) to overall achievement variance, human-centered variables—especially teacher responsiveness (39.6%) and course design (14.8%)—accounted for the majority of explained variance. Regression and variance decomposition analyses indicated that effective teaching and student effort remained dominant predictors of academic success, irrespective of AI use. Subject-level comparisons revealed slight performance advantages for sophisticated AI users in creative and scientific disciplines, though these differences did not consistently reach significance.
Student perceptions of AI improved moderately over time. Mean perception scores rose from 3.12 in 2024 to 3.24 in 2025 (d = 0.10), with students employing AI in both tool and facilitator capacities reporting the highest favorability (M = 4.15). Perception ratings varied by subject, with science and arts students demonstrating the strongest positive attitudes. Across all groups, AI users consistently rated the technology more favorably than non-users—by approximately 1.1 points on a five-point scale.
Overall, longitudinal analyses showed marked increases in AI adoption, growing student confidence and satisfaction, and a reduction in achievement disparities between users and non-users. These results collectively suggest that as AI integration in online learning environments matures, student engagement and familiarity with these tools deepen, leading to more balanced academic performance and improved perceptions of the role of AI in education.
Discussion
Theoretical Implications
The study’s findings present a nuanced understanding of AI integration in K–12 online learning that challenges simplistic linear adoption models. The observed learning-curve effect—where initial performance disparities between AI users and non-users shrink markedly over time—parallels classical adoption theories that describe initial disruption followed by stabilization (Rogers, 2003).
This pattern suggests that concerns about AI automatically undermining academic outcomes may be overstated, at least over the medium term. Additionally, the dominance of combined “tool plus facilitator” usage patterns (sophisticated usage) indicates that effective AI integration is less a binary choice and more a developmental trajectory: students appear to begin with AI as a basic research or summarization tool, then progress toward more sophisticated uses such as tutoring or concept explanation; ultimately utilizing both together to go further faster. This parallels cognitive frameworks (e.g., Bloom’s Taxonomy) where learners move from lower-order processing to higher-order synthesis and evaluation tasks. The doubling in usage for the higher achieving students also provides converging evidence in this area. This increase in adoption and closing of achievement gaps between users and non-users also likely contributes to increasing positive perceptions of AI from year to year, with an established strong relationship between usage and perception in both this study and the prior.
Furthermore, the subject-specific variation in adoption and outcomes supports domain-sensitive models of technology integration: creative and interpretive disciplines (such as visual & performing arts) manifest higher adoption, likely reflecting AI’s affinity for open-ended, generative tasks, whereas mathematics—characterised by procedural, calculation-based learning—shows minimal differential achievement for AI users.
Practical Implications
For educators, the learning curve finding carries critical implications. The initial achievement gap should not trigger restrictive policies but rather inform support strategies during the adaptation period. The 91% reduction in achievement gaps within one year, and large 110% increase in usage in successful students (those with 80% averages or higher) suggests that patience and scaffolding, rather than prohibition, represent appropriate responses to AI integration challenges. Students are succeeding in school and adopting AI tools at a fast pace.
The persistent importance of teacher responsiveness—explaining 39.6% of satisfaction variance compared to AI usage's 4.1%—reinforces that technology complements rather than replaces human instruction. Professional development should therefore focus on helping teachers integrate AI tools while maintaining strong pedagogical relationships, not on replacing traditional instruction with automated systems.
For policymakers, the rapid growth rates (84% overall, 105% for sophisticated usage) indicate that AI integration is accelerating regardless of formal policies. Rather than attempting to control adoption through restrictive measures, policy efforts might better focus on ensuring equitable access, developing usage guidelines, and supporting educator preparation. The lack of socioeconomic disparities in usage rates suggests that access barriers may be less significant than anticipated, though this finding requires replication across diverse contexts.
Recommendations
To operationalize these findings, Michigan Virtual is well-positioned to support educators and institutions in several ways. Based on the implications of the study, a pairing of recommendations and resources is listed below.
Leverage the AI Integration Framework and Planning Guide available via Michigan Virtual’s AI Lab (see: AI Integration Framework, Planning Guide for AI). Michigan Virtual
Offer professional learning micro-credentials targeting teacher responsiveness in AI-augmented instruction (for example: “AI Integration: Student Use” or “AI Integration: Leadership & Vision”). Michigan Virtual
Deploy student-facing AI literacy modules and curated video libraries to scaffold student progression from basic “tool” to advanced “facilitator” usage. Michigan Virtual
Establish piloting opportunities with Michigan Virtual’s Research Institute and AI Lab to gather iterative data on subject-specific effectiveness and refine best practices. Michigan Virtual
Develop a district-level governance checklist (leveraging Michigan Virtual’s Admin Guide to AI) to support equitable, ethical, and efficient AI integration at scale. Michigan Virtual
Limitations
Several limitations constrain the interpretation of these findings. First, the single-institution context limits generalizability to other educational settings, particularly traditional face-to-face instruction. Second, self-reported AI usage may underestimate actual adoption due to social desirability bias or uncertainty about policy compliance. Third, the rapid evolution of AI capabilities means that student experiences with these tools changed substantially during the study period, potentially confounding temporal comparisons.
The achievement measure, while comprehensive, captures only course grades rather than standardized learning outcomes or skill development. Future research should incorporate multiple achievement indicators, including standardized assessments, portfolio evaluations, and long-term retention measures. Additionally, the study's correlational design prevents causal inference about AI's impact on achievement; experimental or quasi-experimental designs are needed to establish causality.
Future Research Directions
This study establishes a foundation for multiple research trajectories. Longitudinal follow-up beyond one year would reveal whether achievement patterns stabilize, reverse, or show continued improvement. Qualitative research examining how students make decisions about AI usage and develop integration strategies would complement these quantitative findings. Experimental studies manipulating AI access or training could establish causal relationships between usage patterns and outcomes.
Investigation of teacher practices and their interaction with student AI usage represents another critical direction. How do effective teachers incorporate AI tools while maintaining instructional relationships? What pedagogical approaches maximize benefits while minimizing risks? These questions require mixed-methods research combining classroom observations, teacher interviews, and student outcome data.
Conclusion
This comprehensive longitudinal analysis provides unprecedented insights into AI integration patterns in K-12 online learning. The key findings—84% growth in usage, 105% increase in sophisticated applications, plus a 110% increase in sophisticated usage amongst the most successful students (those with 80% or higher grades), and 91% reduction in achievement gaps across all students—paint a picture of rapid but ultimately successful technology adoption. The learning curve effect suggests that initial challenges represent adaptation periods rather than fundamental incompatibilities between AI tools and educational goals.
Perhaps most significantly, the study reveals that human relationships remain central to educational success even as AI tools proliferate. Teacher responsiveness emerged as the strongest predictor of both achievement and satisfaction, while AI usage patterns showed relatively modest direct effects. This finding suggests that successful AI integration requires a thoughtful combination of technological tools with sustained human guidance rather than the replacement of traditional instructional relationships.
As AI capabilities continue to expand and adoption rates accelerate, these findings provide crucial baseline data for tracking future developments. The distinction between tool and facilitator usage patterns offers a framework for understanding not just whether students use AI, but how they use it and with what consequences. Educational stakeholders must move beyond binary debates about AI's presence in education to nuanced considerations of implementation quality, support structures, and pedagogical integration.
The rapid changes documented here—particularly the doubling of sophisticated usage in just one year—indicate that the window for proactive policy development is narrowing. Rather than reactive responses to AI proliferation, educational systems need evidence-based frameworks that acknowledge AI's growing presence while maintaining focus on fundamental educational goals. This study provides empirical foundations for such frameworks, demonstrating that thoughtful integration of AI tools can coexist with, and potentially enhance, quality education when implemented with appropriate support and realistic expectations.
References
Beck, J., Stern, M., & Haugsjaa, E. (1996). Applications of AI in education. XRDS: Crossroads, The ACM Magazine for Students, 3(1), 11-15. Doi: 10.1145/332148.332153
Bender, E. M., Gebru, T., McMillan-Major, A., & Shmitchell, S. (2021). On the dangers of stochastic parrots: Can language models be too big? In Proceedings of the 2021 ACM Conference on Fairness, Accountability, and Transparency (pp. 610-623). Association for Computing Machinery. Doi: 10.1145/3442188.3445922
Chen, Y., Jensen, S., Albert, L. J., Gupta, S., & Lee, T. (2023). Artificial intelligence (AI) student assistants in the classroom: Designing chatbots to support student success. Information Systems Frontiers, 25(1), 161-182. Doi: 10.1007/s10796-022-10291-4
Diliberti, M. K., Schwartz, H. L., Doan, S., Shapiro, A., Rainey, L. R., & Lake, R. J. (2024). Using artificial intelligence tools in K–12 classrooms. RAND Corporation. https://www.rand.org/pubs/research_reports/RRA956-21.html
Kumar, V. R., & Raman, R. (2022). Student perceptions on artificial intelligence (AI) in higher education. In 2022 IEEE Integrated STEM Education Conference (ISEC) (pp. 450-454). IEEE. Doi: 10.1109/ISEC54952.2022.10025165
McGehee, N. (2024). AI in Education: Student Usage in Online Learning /research/publications/ai-in-education-student-usage-in-online-learning/
Michigan Virtual. (2025). Annual reports. Retrieved from /about/annual-reports/
Rogers, E. M. (2003). Diffusion of innovations (5th ed.). Free Press.
Selwyn, N. (2019). Should robots replace teachers? AI and the future of education. Polity Press.
Walton Family Foundation. (2024). The value of AI in today's classrooms. https://www.waltonfamilyfoundation.org/learning/the-value-of-ai-in-todays-classrooms
Winkler, R., & Söllner, M. (2018). Unleashing the potential of chatbots in education: A state-of-the-art analysis. In Academy of Management Annual Meeting (AOM). Doi: 10.5465/AMBPP.2018.15903
Zawacki-Richter, O., Marín, V. I., Bond, M., & Gouverneur, F. (2019). Systematic review of research on artificial intelligence applications in higher education—Where are the educators? International Journal of Educational Technology in Higher Education, 16, Article 39. Doi: 10.1186/s41239-019-0171-0Zheng, L., Niu, J., Zhong, L., & Gyasi, J. F. (2023). The effectiveness of artificial intelligence on learning achievement and learning perception: A meta-analysis. Interactive Learning Environments, 31(9), 5650-5664. Doi: 10.1080/10494820.2021.2015693
Appendices
Table A1
Characteristic | 2024 (n = 13,066) | 2025 (n = 13,040) | Total (N = 26,106) |
|---|---|---|---|
Grade Level | n (%) | n (%) | n (%) |
Elementary (K-5) | 67 (0.5) | 64 (0.5) | 131 (0.5) |
Middle School (6-8) | 523 (4.0) | 521 (4.0) | 1,044 (4.0) |
9th Grade | 915 (7.0) | 914 (7.0) | 1,829 (7.0) |
10th Grade | 2,221 (17.0) | 2,217 (17.0) | 4,438 (17.0) |
11th Grade | 3,658 (28.0) | 3,648 (28.0) | 7,306 (28.0) |
12th Grade | 5,682 (43.5) | 5,676 (43.5) | 11,358 (43.5) |
Subject Area | |||
English Language Arts | 954 (7.3) | 952 (7.3) | 1,906 (7.3) |
Mathematics | 1,045 (8.0) | 1,043 (8.0) | 2,088 (8.0) |
Science | 1,620 (12.4) | 1,617 (12.4) | 3,237 (12.4) |
Social Studies | 1,921 (14.7) | 1,918 (14.7) | 3,839 (14.7) |
World Languages | 2,940 (22.5) | 2,936 (22.5) | 5,876 (22.5) |
Visual & Performing Arts | 627 (4.8) | 626 (4.8) | 1,253 (4.8) |
Health & PE | 679 (5.2) | 678 (5.2) | 1,357 (5.2) |
Other | 3,280 (25.1) | 3,270 (25.1) | 6,550 (25.1) |
Locale | |||
Urban | 1,307 (10.0) | 1,304 (10.0) | 2,611 (10.0) |
Suburban | 6,533 (50.0) | 6,520 (50.0) | 13,053 (50.0) |
Rural/Town | 4,573 (35.0) | 4,564 (35.0) | 9,137 (35.0) |
Not Classified | 653 (5.0) | 652 (5.0) | 1,305 (5.0) |
District SES (% FRL) | |||
Low (<25%) | 6,533 (50.0) | 6,520 (50.0) | 13,053 (50.0) |
Moderate (25–50%) | 3,267 (25.0) | 3,260 (25.0) | 6,527 (25.0) |
High (50–75%) | 3,135 (24.0) | 3,130 (24.0) | 6,265 (24.0) |
Very High (>75%) | 131 (1.0) | 130 (1.0) | 261 (1.0) |
Complete Sample Demographics by Year
Table A2
Variable | 1 | 2 | 3 | 4 | 5 | 6 | 7 | 8 |
|---|---|---|---|---|---|---|---|---|
1. Current Grade | — | |||||||
2. AI Usage (0/1) | -.02 | — | ||||||
3. AI Perception | .09** | .35*** | — | |||||
4. Satisfaction | .62*** | .04* | .21*** | — | ||||
5. Teacher Response | .54*** | .02 | .18*** | .70*** | — | |||
6. Grade Level | -.14*** | .16*** | .08** | -.11*** | -.09** | — | ||
7. Prior Experience | .31*** | .11*** | .15*** | .42*** | .38*** | .12*** | — | |
8. Tech Issues | -.28*** | -.03 | -.07** | -.35*** | -.32*** | -.05* | -.24*** | — |
Correlation Matrix of Key Variables (2025 Data)
Section A3 - Regression Models
Table (A3) 1
Predictor Variables | Model 1 | Model 2 | Model 3 | Model 4 | Model 5 | Model 6 |
|---|---|---|---|---|---|---|
Block 1: Control Variables | ||||||
IEP Status | -.15*** (.82) | -.14*** (.81) | -.14*** (.80) | -.13*** (.80) | -.12*** (.79) | -.11*** (.78) |
Course Load | -.08** (.24) | -.07** (.24) | -.07** (.23) | -.07** (.23) | -.06** (.23) | -.05* (.22) |
District SES (% FRL) | -.12*** (.41) | -.11*** (.40) | -.11*** (.40) | -.10*** (.39) | -.09*** (.38) | -.08*** (.37) |
Block 2: Demographics | ||||||
Grade Level | -.14*** (.18) | -.13*** (.18) | -.13*** (.17) | -.12*** (.17) | -.10*** (.16) | |
Subject Area | .06* (.15) | .05* (.15) | .05* (.14) | .05* (.14) | .04 (.13) | |
Locale (Urban/Rural) | -.02 (.31) | -.02 (.31) | -.02 (.30) | -.02 (.30) | -.01 (.29) | |
Block 3: AI Variables | ||||||
AI Usage Type (4 categories) | -.02 (.43) | -.01 (.42) | -.01 (.41) | .01 (.40) | ||
AI Perception (1–5 scale) | .09** (.27) | .07* (.26) | .06* (.25) | .04 (.24) | ||
Year (2024 vs 2025) | .03 (.29) | .03 (.28) | .02 (.28) | .02 (.27) | ||
AI Usage × Year Interaction | -.01 (.18) | -.01 (.17) | .00 (.17) | .00 (.16) | ||
Block 4: Course Experience | ||||||
Teacher Responsiveness & Care | .33*** (.31) | .32*** (.30) | .28*** (.28) | |||
Ease of Use (Course Design) | .18*** (.28) | .17*** (.27) | .14*** (.26) | |||
Prior Experience & Effort | .24*** (.29) | .23*** (.28) | .19*** (.27) | |||
Technical Issues (reversed) | -.11*** (.25) | -.10*** (.24) | -.08** (.23) | |||
Block 5: Interactions | ||||||
Teacher × AI Usage | .03 (.15) | .02 (.14) | ||||
Ease of Use × AI Usage | .02 (.14) | .01 (.13) | ||||
Prior Experience × Grade Level | .05* (.12) | .04 (.11) | ||||
Block 6: Satisfaction | ||||||
Overall Satisfaction | .22*** (.32) | |||||
Model Statistics | ||||||
R² | .043 | .064 | .071 | .284 | .291 | .339 |
Adjusted R² | .043 | .064 | .070 | .283 | .290 | .338 |
ΔR² | .043*** | .021*** | .007** | .213*** | .007* | .048*** |
F | 195.67*** | 148.23*** | 113.45*** | 398.76*** | 312.89*** | 367.42*** |
df | (3, 26102) | (6, 26099) | (10, 26095) | (14, 26091) | (17, 26088) | (18, 26087) |
Full Hierarchical Regression Model Predicting Achievement
Note. N = 26,106. Standardized coefficients (β) reported with standard errors in parentheses.
* p < .05. ** p < .01. *** p < .001.
Table (A3) 2: Variable Importance Analysis (Final Model)
Variable | Standardized β | Semi-Partial r² | Relative Weight | Dominance | Average Importance |
|---|---|---|---|---|---|
Teacher Responsiveness & Care | .28*** | .078 | 32.1% | .412 | 33.2% |
Prior Experience & Effort | .19*** | .036 | 23.8% | .298 | 24.1% |
Grade Level | -.10*** | .010 | 16.2% | .187 | 15.7% |
Ease of Use (Course Design) | .14*** | .020 | 14.3% | .165 | 14.8% |
IEP Status | -.11*** | .012 | 8.9% | .103 | 9.2% |
Technical Issues | -.08** | .006 | 4.7% | .054 | 4.9% |
District SES | -.08*** | .006 | 4.5% | .052 | 4.7% |
Subject Area | .04 | .002 | 3.8% | .044 | 3.9% |
AI Perception | .04 | .002 | 3.2% | .037 | 3.4% |
Course Load | -.05* | .003 | 2.9% | .034 | 3.0% |
AI Usage Type | .01 | .000 | 2.8% | .032 | 2.9% |
Overall Satisfaction | .22*** | .048 | --- | --- | (mediator) |
Relative Importance for Achievement Prediction (Using Multiple Methods)
Note. Importance metrics calculated using multiple approaches: standardized coefficients, squared semi-partial correlations, relative weights analysis, and dominance analysis. Average importance represents the mean across methods. Satisfaction treated as mediator variable.
Table (A3) 3: Detailed Course Experience Variables Impact
Course Experience Component | Items Included | β | SE | p | Zero-Order r | Partial r |
|---|---|---|---|---|---|---|
Teacher Responsiveness & Care | ||||||
- Quick response to questions | Response time <24hrs | .12*** | .09 | <.001 | .42 | .28 |
- Shows genuine care | Care perception | .09*** | .08 | <.001 | .38 | .24 |
- Provides helpful feedback | Feedback quality | .11*** | .09 | <.001 | .41 | .27 |
- Available when needed | Availability rating | .08** | .08 | .002 | .35 | .22 |
Composite Score | .28*** | .28 | <.001 | .52 | .35 | |
Ease of Use (Course Design) | ||||||
- Clear navigation | Navigation rating | .06** | .07 | .003 | .28 | .18 |
- Well-organized content | Organization rating | .07** | .07 | .001 | .31 | .20 |
- Easy to find resources | Resource accessibility | .05* | .06 | .012 | .26 | .17 |
- Intuitive interface | Interface rating | .04* | .06 | .024 | .24 | .15 |
Composite Score | .14*** | .26 | <.001 | .36 | .23 | |
Prior Experience & Effort | ||||||
- Previous online courses | Number of prior courses | .08*** | .08 | <.001 | .34 | .22 |
- Self-reported effort | Effort level (1–10) | .12*** | .09 | <.001 | .39 | .25 |
- Time spent on coursework | Hours per week | .09*** | .08 | <.001 | .36 | .23 |
- Study habits quality | Study habits rating | .07** | .07 | .001 | .32 | .20 |
Composite Score | .19*** | .27 | <.001 | .44 | .29 | |
Technical Issues (reversed) | ||||||
- Platform stability | Crash/error frequency | -.04* | .05 | .018 | -.22 | -.14 |
- Video/audio problems | Media issues | -.03 | .05 | .067 | -.19 | -.12 |
- Login difficulties | Access problems | -.02 | .04 | .124 | -.17 | -.11 |
- Submission errors | Assignment upload issues | -.05* | .05 | .011 | -.24 | -.15 |
Composite Score | -.08*** | .23 | .002 | - .29 | -.18 | |
Breakdown of Course Experience Factors on Achievement
Table (A3) 4: AI Usage Interaction Effects on Achievement
Interaction Term | β | SE | t | p | CI | Interpretation |
|---|---|---|---|---|---|---|
Teacher Response × AI Usage | .02 | .14 | 0.14 | .889 | [-.25, .29] | No moderation effect |
Ease of Use × AI Usage | .01 | .13 | 0.08 | .936 | [-.24, .26] | No moderation effect |
Prior Experience × AI Usage | .03 | .12 | 0.25 | .803 | [-.21, .27] | No moderation effect |
Grade Level × AI Usage | -.04 | .11 | -0.36 | .719 | [-.26, .18] | No moderation effect |
Subject × AI Usage | .05 | .10 | 0.50 | .617 | [-.15, .25] | Varies by subject (see below) |
How AI Usage Moderates Other Predictors
Subject | AI Effect on Achievement | SE | p | Cohen’s d |
|---|---|---|---|---|
Health & PE | +1.6*** | 0.52 | .002 | 0.12 |
Visual & Performing Arts | +1.3* | 0.68 | .028 | 0.10 |
Science | +1.1 | 0.61 | .071 | 0.09 |
Social Studies | +0.5 | 0.58 | .388 | 0.04 |
World Languages | +0.4 | 0.55 | .467 | 0.03 |
Other | +0.3 | 0.51 | .556 | 0.02 |
Mathematics | -0.7 | 0.69 | .310 | -0.05 |
English Language Arts | -0.9 | 0.66 | .173 | -0.07 |
Subject-Specific AI Effects (2025 Only)
Table (A3) 5: Variance Decomposition Analysis
Variance Source | Unique Variance | Shared Variance | Total Contribution |
|---|---|---|---|
Student Factors | |||
- Prior experience/effort | 3.6% | 5.2% | 8.8% |
- Demographics (grade, SES) | 2.1% | 3.4% | 5.5% |
- Individual differences (IEP) | 1.2% | 1.8% | 3.0% |
Instructional Factors | |||
- Teacher responsiveness | 7.8% | 8.4% | 16.2% |
- Course design (ease of use) | 2.0% | 3.8% | 5.8% |
- Technical issues | 0.6% | 1.2% | 1.8% |
AI-Related Factors | |||
- AI usage type | 0.0% | 0.9% | 0.9% |
- AI perception | 0.2% | 1.0% | 1.2% |
- AI interactions | 0.0% | 0.7% | 0.7% |
Satisfaction (Mediator) | 4.8% | --- | 4.8% |
Unexplained Variance | --- | --- | 66.1% |
Total R² | 33.9% | ||
Sources of Variance in Student Achievement
Table A4.
Source | SS | df | MS | F | p | η² |
|---|---|---|---|---|---|---|
2024 Model | ||||||
AI Usage Type | 1,289.43 | 3 | 429.81 | 8.42 | <.001 | .002 |
Grade Level | 3,467.89 | 5 | 693.58 | 13.59 | <.001 | .005 |
Subject Area | 2,891.34 | 7 | 413.05 | 8.09 | <.001 | .004 |
IEP Status | 1,982.67 | 1 | 1,982.67 | 38.86 | <.001 | .003 |
Course Load | 876.45 | 1 | 876.45 | 17.18 | <.001 | .001 |
District SES | 2,134.78 | 3 | 711.59 | 13.94 | <.001 | .003 |
Error | 665,234.89 | 13,041 | 51.01 | |||
Total | 677,877.45 | 13,065 | ||||
2025 Model | ||||||
AI Usage Type | 289.76 | 3 | 96.59 | 1.89 | .128 | <.001 |
Grade Level | 3,512.34 | 5 | 702.47 | 13.77 | <.001 | .005 |
Subject Area | 2,945.67 | 7 | 420.81 | 8.25 | <.001 | .004 |
IEP Status | 2,001.23 | 1 | 2,001.23 | 39.24 | <.001 | .003 |
Course Load | 892.34 | 1 | 892.34 | 17.49 | <.001 | .001 |
District SES | 2,187.45 | 3 | 729.15 | 14.30 | <.001 | .003 |
Error | 663,456.78 | 13,015 | 50.99 | |||
Total | 675,285.57 | 13,039 | ||||
ANCOVA Results for Achievement by AI Usage Type
Table A5
Predictor | B | SE | Wald χ² | p | OR | 95% CI |
|---|---|---|---|---|---|---|
Model: 2025 Data | ||||||
Intercept | -4.82 | 0.31 | 241.89 | <.001 | 0.01 | |
Grade Level | 0.17 | 0.02 | 72.25 | <.001 | 1.18 | [1.14, 1.22] |
AI Perception | 0.51 | 0.03 | 289.44 | <.001 | 1.67 | [1.59, 1.75] |
Subject (ref: Math) | ||||||
English | 0.23 | 0.09 | 6.55 | .010 | 1.26 | [1.06, 1.50] |
Science | 0.19 | 0.08 | 5.66 | .017 | 1.21 | [1.03, 1.42] |
Social Studies | 0.18 | 0.08 | 5.09 | .024 | 1.20 | [1.02, 1.41] |
Visual Arts | 0.67 | 0.11 | 36.97 | <.001 | 1.95 | [1.57, 2.42] |
World Languages | -0.14 | 0.09 | 2.41 | .120 | 0.87 | [0.73, 1.04] |
Health/PE | -0.08 | 0.11 | 0.53 | .467 | 0.92 | [0.74, 1.14] |
Other | 0.15 | 0.08 | 3.52 | .061 | 1.16 | [0.99, 1.36] |
Teacher Response | 0.08 | 0.02 | 16.00 | <.001 | 1.08 | [1.04, 1.12] |
Prior Experience | 0.12 | 0.02 | 36.00 | <.001 | 1.13 | [1.09, 1.17] |
District SES | -0.03 | 0.03 | 1.00 | .317 | 0.97 | [0.91, 1.03] |
Locale Urban (ref: Rural) | 0.09 | 0.08 | 1.27 | .260 | 1.09 | [0.93, 1.28] |
Locale Suburban | 0.06 | 0.06 | 1.00 | .317 | 1.06 | [0.94, 1.19] |
Model χ² | 892.34 | <.001 | ||||
Nagelkerke R² | .127 | |||||
Classification Accuracy | 88.9% | |||||
Logistic Regression Predicting AI Usage (Both Tool & Facilitator)
Table A6
Usage Type | 2024 | 2025 | Change | ||
|---|---|---|---|---|---|
M | SD | M | SD | Δ | |
No AI Use | 89.1 | 15.2 | 90.7 | 14.8 | +1.6 |
Tool Only | 87.4 | 16.1 | 91.6 | 14.2 | +4.2** |
Facilitator Only | 88.2 | 15.8 | 87.9 | 15.6 | -0.3 |
Both Tool & Facilitator | 84.3 | 17.2 | 87.1 | 16.1 | +2.8* |
Overall | |||||
All AI Users | 86.7 | 16.5 | 88.9 | 15.4 | +2.2** |
All Students | 88.7 | 15.4 | 90.2 | 14.9 | +1.5*** |
Means and Standard Deviations for Satisfaction by AI Usage Type and Year
Note. Satisfaction measured on 0-100 scale.
* p < .05. ** p < .01. *** p < .001 for year-over-year change.
Table A7
Comparison | 2024 | 2025 | Change in Effect |
|---|---|---|---|
Achievement: Both Users vs. Non-Users | |||
Overall | -0.17 | -0.02 | +0.15 |
Mathematics | -0.21 | -0.05 | +0.16 |
Science | -0.19 | +0.09 | +0.28 |
English | -0.23 | -0.07 | +0.16 |
Visual Arts | -0.14 | +0.10 | +0.24 |
Perception: Users vs. Non-Users | |||
Overall | 0.89 | 0.94 | +0.05 |
Tool Only | 0.58 | 0.66 | +0.08 |
Facilitator Only | 0.63 | 0.72 | +0.09 |
Both Tool & Facilitator | 0.87 | 0.93 | +0.06 |
Satisfaction: Users vs. Non-Users | |||
Overall | -0.15 | -0.12 | +0.03 |
Both Tool & Facilitator | -0.29 | -0.23 | +0.06 |
Effect Sizes (Cohen's d) for Key Comparisons
Note. Positive values indicate advantage for first group in comparison. Effect size interpretations: 0.2 = small, 0.5 = medium, 0.8 = large.
Table A8
Variables | χ² | df | p | Cramer's V | N |
|---|---|---|---|---|---|
2025 Data | |||||
AI Usage × Grade Level | 89.34 | 12 | <.001 | .083 | 13,040 |
AI Usage × Subject Area | 156.78 | 21 | <.001 | .109 | 13,040 |
AI Usage × District SES | 4.12 | 9 | .904 | .018 | 13,040 |
AI Usage × Locale | 5.89 | 9 | .751 | .021 | 13,040 |
Cross-Year Comparisons (Usage Type × Year) | |||||
AI Usage Type × Grade Level | 124.56 | 20 | <.001 | .098 | 13,040 |
AI Usage Type × Subject | 287.91 | 35 | <.001 | .149 | 13,040 |
Year-over-Year | |||||
Year × AI Usage | 423.45 | 1 | <.001 | .127 | 26,106 |
Year × Both Tool & Facilitator | 287.91 | 1 | <.001 | .105 | 26,106 |
Year × AI Perception Category | 67.89 | 4 | <.001 | .051 | 26,106 |
Chi-Square Tests of Independence for Categorical Variables